


Diet quality varies with social status, and this contributes to health in-equalities.1 There is evidence that retail food prices are higher in rural and remote localities than urban areas throughout Australia, and this may have negative nutrition and health consequences.2-8
The 2004 Healthy Food Access Basket (HFAB) survey was the fourth biennial state-wide cross-sectional survey of the costs and availability of a standard basket of basic healthy food items throughout Queensland. The HFAB survey was piloted in north Queensland in 1997 before state-wide surveys were conducted in 1998,9 2000,3 20014 and 2004.10 The 2001 HFAB survey was performed 1 year earlier than the originally scheduled survey date (2002) in order to capture any effect of the new tax system that included the goods and services tax (GST), which commenced on 1 July 2000.
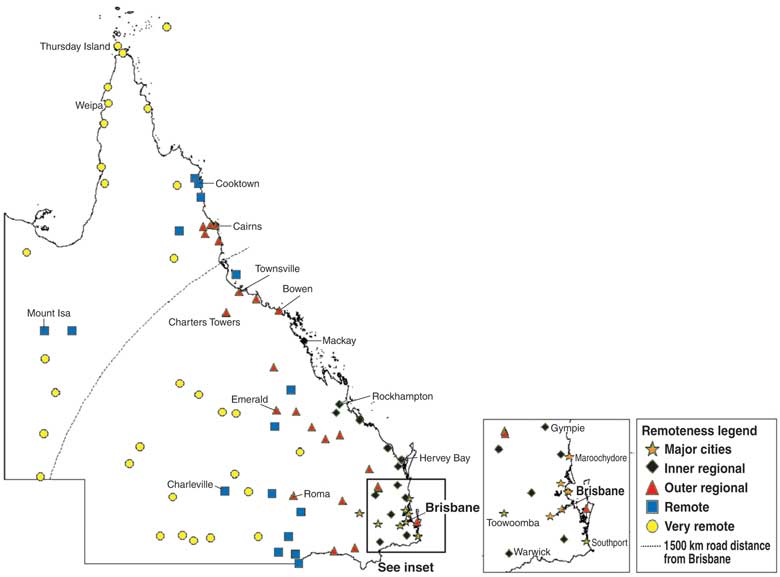
Selected stores were categorised by the Australian Bureau of Statistics remoteness structure11 and using the updated Accessibility/Remoteness Index of Australia (ARIA+)12 by populated localities as the basis for the definition of remoteness (see map, page 9). ARIA+ defines localities in terms of remoteness of geographical location as well as access to services.
The range and type of foods included in the HFAB represent commonly available and popular foods selected to provide 70% of the nutritional requirements and 95% of the estimated energy requirements of a “reference family” of six people over a 2-week period (Box 1).13
Basic healthy foods in the HFAB include bread and cereals; fruit, vegetables and legumes; meat and meat alternatives; dairy foods; and limited amounts of some energy-dense foods (margarine, oil and sugar). The quantities of food included in the HFAB are based on model B of the core food groups.13 For comparative purposes, two takeaway foods (190 g meat pie, 375 mL cola beverage) and two tobacco items (50 g tobacco, pack of 25 cigarettes) were also surveyed (they are referred to as “unhealthy” items in our analysis). Information about missing HFAB items was also collected. Only missing items for the total basket from stores surveyed from 2000 to 2004 were compared.
Stores were not advised of the specific date and time of surveys, so that results reflect usual availability and cost for consumers. Details relating to selection of brands and sizes of food items are described elsewhere.3
The cost of the total HFAB; the fruit, vegetables and legumes in the basket; and the unhealthy items were compared by remoteness category for the 97 stores surveyed in 2004. Changes in cost and availability of foods since the previous two surveys (2000 and 2001) were also analysed by remoteness category for the 81 stores that were included in all three surveys. Further comparisons of food prices were made for the 56 stores that were included in all four surveys (1998, 2000, 2001 and 2004), and increases were compared with increase in the Consumer Price Index (CPI) for food in Brisbane over the same period.14 Because the usual store stocking practices for ham and cabbage changed after the 1998 survey, the total basket could only be compared from 2000 onwards.
The 2004 HFAB survey results show a trend of increasing food prices with increasing remoteness category (Box 2). In the “very remote” category, the cost of the HFAB was 29.6% ($113.89) higher than in the “major cities” category, and the cost of fruit, vegetables and legumes was 20.3% ($32.34) higher. Furthermore, there were significant differences within the very remote category. For very remote stores > 1500 km from Brisbane (n = 16), the cost of the total HFAB was 13.2% ($61.69) higher and the cost of fruit, vegetables and legumes 18.8% ($32.91) higher than in very remote stores < 1500 km from Brisbane (n = 16) (see map). The cost disparity across remoteness categories for the unhealthy items was less than for the HFAB, with the cost of takeaway and tobacco items in the very remote category being 14.2% ($4.47) higher than in the major cities category (P < 0.001).
There were significant differences in the cost of items in all basic healthy food groups13 by remoteness category. The differences between remoteness categories were greater for the “bread and cereals” and “dairy” groups than for the “fruit” and the “vegetables and legumes” groups (Box 2).
There has been an increase in the price of basic healthy food in the 81 stores that were surveyed in 2000, 2001 and 2004 (Box 3). Between the 2001 and 2004 surveys, the Queensland average price of the HFAB increased by 14.0% ($48.45). The cost of the HFAB increased significantly more in very remote areas (18.0%, $76.93) compared with major cities (13.2%, $44.96, P < 0.001).
State-wide, the price of fruit, vegetables and legumes in the basket increased by 17.9% ($24.98) between 2001 and 2004 (Box 3). Differences in the price of fruit, vegetables and legumes in the basket across the remoteness categories were not as great as those seen for the total HFAB. Within the fruit, vegetables and legumes group, price increases were greatest for fruit.
Annualised per cent increases in costs for the 56 stores surveyed from 1998 to 2004 compared with changes in the CPI for food in Brisbane over the same period are shown in Box 4. The most dramatic change in food costs was between 2000 and 2001. The introduction of the GST may be one factor contributing to the increase in CPI for food in Queensland during that time.15 The price changes in the CPI for food in Brisbane were very similar to those found for Australia as a whole.14
Basic healthy food items are less likely to be available in “outer regional”, “remote” and “very remote” areas (Box 5), with almost 11% of HFAB food items not available for purchase in stores in remote and very remote areas in 2004. The most frequently missing HFAB items (in descending order) were wholemeal flour, powdered skim milk, frozen chicken, wholemeal bread, 100% fruit juice, bananas, tinned ham, rolled oats, fresh reduced-fat milk, cabbage and long-life full-cream milk.
While the higher price increases for the HFAB in more remote areas raise concern about food access and availability for good health, the overall substantial price increases experienced in all five remoteness categories raise a potential barrier to healthy food access for all Queenslanders. This is particularly the case for people of low socioeconomic status and other vulnerable groups, such as Indigenous people, who are known to suffer a greater burden of ill health than other Australians.16 Higher prices may be a barrier to healthy eating that can compromise nutritional and health status and add to the burden of obesity and chronic disease.17 Earlier studies have identified poor food and health knowledge and undeveloped cooking and budgeting skills as additional barriers to good health.8 Various environmental influences, including food access, contribute to the higher death rates experienced by people from more socioeconomically disadvantaged and remote areas.18
While a number of reports have stated that the effect of the introduction of the GST was mainly captured in the September 2000 quarter,15,19 they do not explain the substantial cost increases for basic food items between 2000 and 2001 — costs that were actually predicted to fall with the introduction of the GST.20 With steady or declining farmers’ prices and little or no impact of drought on retail prices at the time, it has been suggested that other factors, including retailing issues, contributed to these cost increases.21
Despite a “stabilisation” in CPI for food in Brisbane over the financial year 2003–04, the HFAB cost increase has continued to be higher than the CPI for food across all remoteness categories for the 56 stores surveyed from 1998 to 2004 (Box 4). This suggests that the cost for basic foods necessary to achieve good health has become, and continues to be, more expensive than less nutritious alternatives, as included in the basket to calculate the CPI for food. The price gap between healthy and unhealthy foods has also been illustrated in the United States17 and France.22 With price identified as the most important factor in decisions about what food items to buy,23 the health of all Queenslanders may be compromised as a result.
The decline in availability of basic healthy food items with increasing store remoteness (Box 5) also raises concerns for consumers regarding food security and the ability to maintain good health. While the count of available HFAB items fails to discriminate between items not available on the day and those never stocked, time delays in restocking sold-out lines may have an impact on consumer access to healthy foods that could put some individuals at increased nutritional and health risk.
Factors affecting the price, availability and quality of food supply are complex and exist at local, state and national levels. There needs to be an investigation to identify these factors, so that strategies can be developed to improve affordability and access to healthy food for all Queenslanders.
Location and Australian Bureau of Statistics remoteness classifications11,12 for the 97 stores in the 2004 Healthy Food Access Basket survey
1 The 2004 Healthy Food Access Basket (HFAB) — foods and quantities for a “reference family”* over a 2-week period
2 Mean cost (95% CI) of the Healthy Food Access Basket (HFAB) and basic healthy food groups in the 97 stores surveyed in 2004, by remoteness category*†11,12
% ($) increase in mean cost from major cities to very remote areas |
|||||||||||||||
3 Mean cost (95% CI) and increase in mean cost of Healthy Food Access Basket (HFAB) and “fruit, vegetables and legumes” group in the 81 stores surveyed between 2000 and 2004, by remoteness category*†11,12
4 Annualised per cent change in costs* (95% CI) in the 56 stores surveyed between 1998 and 2004†‡ compared with the increase in Consumer Price Index (CPI)14 for food in Brisbane over the same period, by remoteness category11,12
* Ham and cabbage excluded. † Weighting proportional to Queensland population size by each remoteness category. ‡ Source: Healthy Food Access Basket surveys 1998, 2000, 2001 and 2004.3,4,9,10
- Michelle S Harrison1
- Terry Coyne2
- Amanda J Lee1
- Dympna Leonard3
- Simone Lowson4
- Anita Groos5
- Bronwyn A Ashton1
- 1 Health Promotion Unit, Population Health Branch, Queensland Health, Brisbane, QLD.
- 2 School of Population Health, University of Queensland, Brisbane, QLD.
- 3 Tropical Population Health Network, Queensland Health, Cairns, QLD.
- 4 Southern Area Population Health Service, Queensland Health, Brisbane, QLD.
- 5 Central Area Population Health Service, Queensland Health, Brisbane, QLD.
Our research was funded by Queensland Health.
- 1. World Health Organization. Social determinants of health: the solid facts. 2nd ed. Geneva: WHO, 2003.
- 2. Queensland Treasury. Index of retail prices in regional centres. Brisbane: Office of Economic and Statistical Research, Queensland Treasury, 2001.
- 3. Queensland Health. The 2000 Healthy Food Access Basket (HFAB) survey. Brisbane: Queensland Health, 2001. http://www.health.qld.gov.au/phs/documents/shpu/9137.pdf (accessed Sep 2006).
- 4. Queensland Health. The 2001 Healthy Food Access Basket (HFAB) survey. Brisbane: Queensland Health, 2003. http://www.health.qld.gov.au/phs/Documents/shpu/21629.pdf (accessed Sep 2006).
- 5. Northern Territory Government Department of Health and Community Services. Market basket survey of remote community stores in the Northern Territory April–June 2002. Darwin: Nutrition and Physical Activity Unit, Department of Health and Community Services, 2002.
- 6. Meedeniya J, Smith A, Carter P. Food supply in rural South Australia: a survey of food cost, quality and variety. Adelaide: Department of Human Services, 2000.
- 7. Burns C, Gibbons P, Boak R, et al. Food cost and availability in a rural setting in Australia. Rural Remote Health [Internet] 2004; 4: 311. http://rrh.deakin.edu.au/articles/subviewnew.asp?ArticleID=311 (accessed Sep 2006).
- 8. Sullivan H, Gracey M, Hevron V. Food costs and nutrition of Aborigines in remote areas of northern Australia. Med J Aust 1987; 147: 334-337.
- 9. Queensland Health. The 1998 Healthy Food Access Basket (HFAB) survey. Cairns: Queensland Health, 1999.
- 10. Queensland Health. The 2004 Healthy Food Access Basket (HFAB) survey. Brisbane: Queensland Health, 2005. http://www.health.qld.gov.au/phs/Documents/shpu/30605.pdf (accessed Nov 2006).
- 11. Australian Bureau of Statistics. Information paper: outcomes of ABS views on remoteness consultation, Australia. Canberra: ABS, 2001.
- 12. GISCA, University of Adelaide. ARIA+ version 2: Accessibility/Remoteness Index of Australia. Adelaide: University of Adelaide, 2004. http://www.gisca.adelaide.edu.au/products_services/ariav2.html (accessed Sep 2006).
- 13. Cashel K, Jeffreson S. The core food groups. Canberra: National Health and Medical Research Council, 1992.
- 14. Australian Bureau of Statistics. Quarterly CPI publication (June quarter 1998–2004). Canberra: ABS, October 1998–July 2004. (ABS Cat. No. 6455.0.40.001.)
- 15. Australian Bureau of Statistics. Special article – measuring the impact of the new tax system on the September quarter 2000 Consumer Price Index. Canberra: ABS, 2000. (ABS Cat. No. 1350.0.)
- 16. Australian Institute of Health and Welfare. Rural, regional and remote health: mortality trends 1992–2003. Canberra: AIHW, 2006. (AIHW Cat. No. PHE 71.)
- 17. Drewnowski A, Darmon N. The economics of obesity: dietary energy density and energy cost. Am J Clin Nutr 2005; 82 Suppl: S265-S273.
- 18. Queensland University of Technology and Australian Institute of Health and Welfare. Health inequalities in Australia: mortality. Canberra: QUT and AIHW, 2004.
- 19. Australian Competition and Consumer Commission. GST final report: ACCC oversight of pricing responses to the introduction of the new tax system. Canberra: ACCC Publishing Unit, 2003.
- 20. Australian Competition and Consumer Commission. Report on ACCC price surveys: general survey. Canberra: ACCC Publishing Unit, 2001.
- 21. Spencer S. Price determination in the Australian food industry: a report. Canberra: Australian Government Department of Agriculture, Fisheries and Forestry, 2004.
- 22. Andrieu E, Darmon N, Drewnowski A. Low-cost diets: more energy, fewer nutrients. Eur J Clin Nutr 2006; 60: 434-436.
- 23. Queensland Department of Primary Industries. Queenslanders’ attitudes toward everyday food items. Newsletter. Brisbane: DPI, 2001.
Abstract
Objective: To assess changes in the cost and availability of a standard basket of healthy food items (the Healthy Food Access Basket [HFAB]) in Queensland over time.
Design and participants: A series of four cross-sectional surveys (in 1998, 2000, 2001 and 2004) describing the cost and availability of foods in the HFAB over time. In the latest survey, 97 Queensland food stores across the five Australian Bureau of Statistics remoteness categories were compared.
Main outcome measures: Cost comparisons for HFAB items by remoteness category for the 97 stores surveyed in 2004; changes in cost and availability of foods in the 81 stores surveyed since 2000; comparisons of food prices in the 56 stores surveyed in 1998, 2000, 2001 and 2004.
Results: In 2004, the Queensland mean cost of the HFAB was $395.28 a fortnight. The cost of the HFAB was 29.6% ($113.89) higher in “very remote” areas than in “major cities” (P < 0.001). Between 2001 and 2004, the Queensland mean cost of the HFAB increased by 14.0% ($48.45), while in very remote areas the cost increased by 18.0% ($76.93) (P < 0.001). Since 2000, the annualised per cent increase in cost of the HFAB has been higher than the increase in Consumer Price Index for food in Brisbane. The cost of healthy foods has risen more than the cost of some less nutritious foods, so that the latter are now relatively more affordable.
Conclusions: Consumers, particularly those in very remote locations, need to pay substantially more for basic healthy foods than they did a few years ago. Higher prices are likely to be a barrier to good health among people of low socioeconomic status and other vulnerable groups. Interventions to make basic healthy food affordable and accessible to all would help reduce the high burden of chronic disease.