


Consensus is emerging about the adverse health effects of particulate air pollution. A recent report of the Australian National Environment Protection Council (NEPC) suggests that each increase of 10 µg/m3 in the ambient concentration of respirable particulates is associated with a 3.0% increase in exacerbations of asthma.1 This estimate was derived from published studies of the health effects of air pollution in large urban settings where particulate pollution originates from motor vehicles, and domestic and industrial sources.2
There have been very few studies on exposure to particulate pollution from bushfires. In the United States, after widespread forest fires, there was a 40% increase in patients presenting to hospital with asthma,3 while, in Singapore, the pollution generated by forest fires in Kalimantan and Sumatra in 1997 was associated with a 19% increase in attendances for asthma.4 However, in Australia, only one of three studies has supported a link between bushfire smoke and asthma,5-7 and a further study did not find any clinically significant reduction in peak expiratory flow rates in children with wheeze during a severe bushfire episode.8 A limitation of all these studies is that they are necessarily based on post-hoc comparisons of asthma presentation rates after an unexpected fire event compared with an "equivalent" historical period. They are thus vulnerable to errors caused by bias, including unmeasurable confounding factors.
The continuous monitoring of levels of airborne particles in Darwin (Northern Territory, Australia) during 2000 provided a unique opportunity to examine the association between airborne particulate concentration and hospital asthma presentations.
The study was conducted in Darwin during the "dry" season from 1 April to 31 October 2000, which is characterised by minimal rainfall and almost continuous bushfire activity in the proximate bushland. The outcome measure was the daily number of presentations for asthma to the Emergency Department of Royal Darwin Hospital (RDH), the main referral centre for the region. All Emergency Department clinical diagnoses are coded according to the classification system of the International classification of diseases, 9th revision, clinical modification (ICD-9-CM).9 We extracted the daily number of cases assigned to codes 493.00 (childhood asthma) and 493.9 (asthma not elsewhere classified). The latter category is used by this database for all types of adult asthma.
The exposure variable was the mean atmospheric concentration of particles of 10 microns or less in aerodynamic diameter per cubic meter (PM10) per 24-hour period. These data were collected at two locations about 7 km apart in the Darwin suburbs of Berrimah and Nakara. At Berrimah the PM10 loadings were continuously measured using a tapered element oscillating mass balance, and at Nakara gravimetric mass and airborne PM10 lead loadings were determined by filter collections using a Microvol aerosol sampler (Ecotech Pty Ltd, Blackburn, Victoria) with a 10-µm-sized selective inlet. Details of the methods and results of the air quality sampling have been reported separately.10
We were confident that the reported particulate levels provided a good estimation of the exposure experienced by most residents of Darwin, as the geographic area is small and there is little spatial variation in air pollution levels. This assumption is supported by the high correlation between measurements of PM10 levels from the two sites (r = 0.89).10
We controlled for the effects of two potential confounding variables.
-
Acute respiratory infections. These exacerbate asthma, and are associated with high PM10 concentrations11 and with the winter months.12 Sentinel general practitioners (GPs) in the Darwin region routinely report the proportion of their consultations meeting a standard clinical case definition of influenza, which, in aggregate, yields weekly presentation rates for influenza-like illness per 1000 general practice consultations.12
-
Weekdays v weekends. Nearly all fires near Darwin are ignited by people and occur much more frequently on weekends (Mr B Williams, Executive Officer, Bushfires Council of the Northern Territory, personal communication). In addition, presentations to the Emergency Department may be higher on weekends, when there are fewer general practice services available.13 Thus, it was important to distinguish between weekdays and weekends to avoid overestimating the effect of PM10 on asthma presentations.
The analysis was conducted in STATA14 using negative binomial regression, which provides estimates of the rate ratio. Negative binomial regression is used for count data when the counts are overdispersed, making a Poisson model inappropriate, as it would underestimate the variance.15
To examine the impact of PM10 concentrations on asthma presentations, we fitted PM10 as a continuous variable, divided by 10, to test for trend. We categorised PM10 as < 10 µg/m3, 10–< 20 µg/m3, 20– < 30 µg/m3, 30– < 40 µg/m3 and ≥ 40 µg/m3, and fitted additional models with lag times of one, three and five days. For this analysis, we assumed that the denominator (the population of Darwin) remained constant throughout the study period. We also plotted a non-weighted smoothing function of asthma presentations on same-day mean PM10 concentrations using the "ksm" command in STATA.15 We tested for the significance of categorical variables with the likelihood ratio statistic and used the Wald statistic for analysing continuous variables.
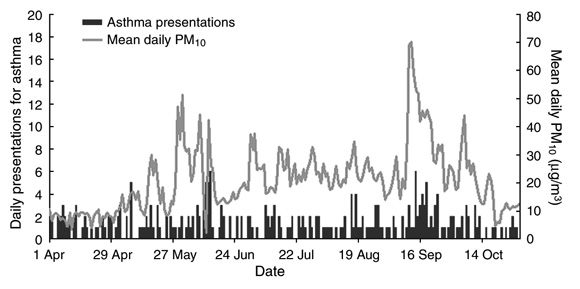
The total number of presentations with asthma during the seven-month study period was 265, with a mean of 1.2 presentations per day (range, 0–6), or 8.5 per week (range, 3–20). The mean daily PM10 and number of asthma attendances per day for the study period are shown in Box 1.
The mean daily PM10 for the entire study period was 20.84 µg/m3 (95% CI, 20.30–21.38). The range was 2.0–70.0 µg/m3. There were two peaks, the first in May and the second in September. The National Environment Protection Council target for maximum mean 24-hour PM10 of 50 µg/m3 was exceeded on a total of six days (a single day in May and five consecutive days in September). The number of days on which the average PM10 concentrations were < 10, 10– < 20, 20– < 30, 30– < 40 and ≥ 40 µg/m3 was 39, 74, 65, 20 and 16, respectively.
We tested to see if the relationship between PM10 and asthma presentations was non-linear by fitting quadratic, natural logarithmic and square-root functions; however, the linear function fitted best with the data. Test for trend showed there was a significant increase in asthma presentations with each 10-µg/m3 increase in PM10 (rate ratio, 1.18; 95% CI, 1.08–1.31; P < 0.001), an effect that remained unchanged when we adjusted for weekly rates of influenza and for weekday versus weekend (rate ratio, 1.20; 95% CI, 1.09–1.34; P < 0.001).
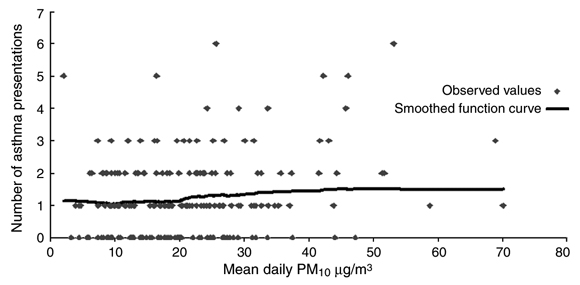
Box 2 shows the scatter plot of mean daily PM10 concentrations and asthma presentations and a smoothed function curve. This suggests that the relationship between asthma and mean PM10 was flat until a PM10 of 20 µg/m3, when it started to increase in a linear fashion before flattening again at higher concentrations. More data are required to explore whether 20 µg/m3 represents a real threshold.
Box shows the results of the analysis of asthma presentations and particulate exposure levels for same-day PM10 concentrations, and after lag times of one, three and five days, by PM10 category. Only when the PM10 concentration was greater than or equal to 40 µg/m3 was there a statistically significant increase in the risk of asthma when compared with the baseline category of less than 10 µg/m3 (rate ratio, 2.21; 95% CI, 1.40–3.52) for same-day PM10 concentrations. This remained significant after adjusting for day of week and weekly rates of influenza (adjusted rate ratio, 2.39; 95% CI, 1.46–3.90).
We also fitted a model with six categories, including 40– < 50 and ≥ 50 µg/m3, but these did not improve the model fit and we found similar adjusted incidence rate ratios for the categories of > 40–50 µg/m3 (incidence rate ratio, 2.32; 95% CI, 1.32–4.02) and ≥ 50 µg/m3 (incidence rate ratio, 2.50; 95% CI, 1.28–4.91). The strongest effect for PM10 was found for analysis of PM10 concentrations ≥ 40 µg/m3 after a lag time of five days. These were similar to the rate ratios for same-day exposures and asthma presentations, and slightly higher than the rate ratios associated with intervening lag times.
The positive association between PM10 and asthma presentations we demonstrated is supported by recent large reviews of both epidemiological and biological studies,16-19 but the association between asthma and particulates we found was stronger than previously reported. We also observed a much greater association with presentations for asthma when the mean daily PM10 was above 40 µg/m3. Further studies are needed to determine whether a threshold is present at this or lower PM10 concentrations, as this has implications for setting air quality targets.
Measuring exposure to and outcomes of bushfire particulate pollution in Darwin provides a number of advantages.
-
Darwin has no significant source of atmospheric air pollution other than bushfires.10
-
The reliability of exposure measurement is enhanced by the region's highly predictable dry-season climate, characterised by steady south-easterly winds, negligible rainfall, low atmospheric humidity, and consistently high air temperatures.20 Bushfires occur annually throughout the dry season, providing a continuous background of smoke pollution, with peaks and troughs over several months.
-
Smoke particles are trapped by a temperature inversion at about 3000 m altitude, producing regionally widespread and persistent haze (Mr J Arthur, Chief Meteorologist, Darwin Bureau of Meteorology, personal communication).
-
Darwin has a relatively small population, with a mid-year estimate of about 115 000 people (2000 mid-year estimate of the Epidemiology Branch, Northern Territory Department of Health and Community Services) served by a single major hospital (Royal Darwin Hospital) with systematic data collection systems.
We do not believe that our findings can readily be explained by bias or confounding effects, but recognise our study's limitations. Firstly, in keeping with an ecological study design, we did not have information about individual patients, such as duration of exposure, lifestyle factors, or age. Secondly, we were unable to adjust for pollen or mould levels, which are important environmental precipitants of asthma, as these are not routinely measured in Darwin. However, it is extremely unlikely that fires and atmospheric concentrations of these biological particles are systematically related to smoke levels. Nearly all the fires are, for a range of motives, started by people. Finally, the outcome data may have been biased by under-reporting and misclassification, but these errors would be independent of PM10 levels and the resulting bias would be in the direction of a null effect.
We conclude that airborne particulates from bushfires should be considered as equally injurious to human health as those from other sources. Thus, the control of smoke pollution from bushfires near urban areas presents an additional challenge for managers of fireprone landscapes.21
Received 26 October 2001, accepted 28 March 2002
- Fay H Johnston1
- Anne M Kavanagh2
- David M J S Bowman3
- Randall K Scott4
- 1 Menzies School of Health Research, Casuarina, NT.
- 2 Australian Research Centre for Sex, Health and Society, La Trobe University, Melbourne, VIC.
- 3 Key Centre for Tropical Wildlife Management, Northern Territory University, Darwin, NT.
- 4 Environment and Heritage Division, Northern Territory Department of Lands, Planning and Environment, Darwin, NT.
The Emergency Department of Royal Darwin Hospital provided data from its attendance register, and the Darwin Centre for Disease Control provided data from the Tropical Influenza Surveillance System. Anne Kavanagh is supported by a VicHealth Senior Research Fellowship. The study was funded by the Northern Territory Government Department of Lands, Planning and Environment.
None declared.
- 1. National Environment Protection Council. Ambient Air Quality Final Impact Statement and Assessment. Adelaide: NEPC, 1998. Available at: http://nepc.gov.au/pdf/air_is0698.pdf (accessed April 2002).
- 2. Streeton JA. A review of existing health data on six air pollutants. Report to the National Environment Protection Council, Australia. Adelaide: NEPC, 1997.
- 3. Duclos P, Sanderson LM, Lipsett M. The 1987 forest fire disaster in California: assessment of emergency room visits. Arch Environ Health 1990; 45: 53-58.
- 4. Emmanuel SC. Impact to lung health of haze from forest fires: the Singapore experience. Respirology 2000; 5: 175-182.
- 5. Churches T, Corbett S. Asthma and air pollution in Sydney. NSW Public Health Bulletin 1991; 8: 72.
- 6. Smith MA, Jalaludin B, Byles JE, et al. Asthma presentations to emergency departments in western Sydney during the January 1994 bushfires. Int J Epidemiol 1996; 5: 1227-1236.
- 7. Cooper C, Mira M, Danforth M, et al. Acute exacerbations of asthma and bushfires [letter]. Lancet 1994; 343: 1509.
- 8. Jalaudin B, Smith M, O'Toole B, Leeder S. Acute effects of bushfires on peak expiratory flow rates in children with wheeze: a time series analysis. Aust N Z J Public Health 2000; 42: 174-177.
- 9. National Center for Health Statistics. International classification of diseases. 9th revision, clinical modification. Second edition. Hyattsville, Md: National Center for Health Statistics, 1980.
- 10. CSIRO Atmospheric Research. A pilot study of air quality in Darwin NT. Report to the Northern Territory Government Department of Lands Planning and Environment. 2001. Available at: http://www.lpe.nt.gov.au/enviro/wmpcreg/AirQ/AQStudy/AQStudy.pdf (accessed April 2002).
- 11. Ezzati M, Kammen DM. Indoor air pollution from biomass combustion and acute respiratory infections in Kenya: an exposure response study. Lancet 2001; 358: 619-624.
- 12. Johnston F. Tropical Influenza Surveillance. Commun Dis Intell 1996; 20: 282-283.
- 13. Hider P, Helliwell P, Ardagh M, Kirk R. The epidemiology of emergency department visits in Christchurch. N Z Med J 2001; 114: 157-159.
- 14. STATA [computer program], version 7. College Station, Tex: Stata, 2001.
- 15. STATA 7 reference manual. College Station, Tex: Stata Press, 2001.
- 16. Petroschevsky A, Simpson RW, Thalib L, Rutherford S. Associations between outdoor air pollution and hospital admissions in Brisbane, Australia. Arch Environ Health 2001; 56: 37-52.
- 17. Morgan G, Corbett S, Wlodarczyk J. Air pollution and hospital admissions in Sydney, Australia, 1990 to 1994. Am J Public Health 1998; 88: 1761-1766.
- 18. Goldsmith CW, Kobzik L. Particulate air pollution and asthma: a review of epidemiological and biological studies. Rev Environ Health 1999; 14: 121-134.
- 19. National Environment Protection Council. Issues Paper: The need for a PM2.5 standard in Australia. Adelaide: NEPC, 2001. Available at: http://www.ephc.gov.au/pdf/Air_Variation_PM25/issues_paper.pdf (updated, accessed August 2005).
- 20. Gill AM, Moore PHR, Williams RJ. Fire weather in the wet-dry tropics of the World Heritage Kakadu National Park, Australia. Aust J Ecol 1996; 21: 302-308.
- 21. Gonzalez-Caban A. Managerial and institutional factors affect prescribed burning costs. Forest Sci 1997; 43: 535-543.
Abstract
Objective: To examine the relationship between the mean daily concentration of respirable particles arising from bushfire smoke and hospital presentations for asthma.
Design and setting: An ecological study conducted in Darwin (Northern Territory, Australia) from 1 April – 31 October 2000, a period characterised by minimal rainfall and almost continuous bushfire activity in the proximate bushland. The exposure variable was the mean atmospheric concentration of particles of 10 microns or less in aerodynamic diameter (PM10) per cubic metre per 24-hour period.
Outcome measure: The daily number of presentations for asthma to the Emergency Department of Royal Darwin Hospital.
Results: There was a significant increase in asthma presentations with each 10-µg/m3 increase in PM10 concentration, even after adjusting for weekly rates of influenza and for weekend or weekday (adjusted rate ratio, 1.20; 95% CI, 1.09–1.34; P < 0.001). The strongest effect was seen on days when the PM10 was above 40 µg/m3 (adjusted rate ratio, 2.39; 95% CI, 1.46–3.90), compared with days when PM10 levels were less than 10 µg/m3.
Conclusion: Airborne particulates from bushfires should be considered as injurious to human health as those from other sources. Thus, the control of smoke pollution from bushfires in urban areas presents an additional challenge for managers of fireprone landscapes.