


The known Stress among farmers is influenced by drought and a range of socio-demographic and community factors that exacerbate stress related to their occupation and rural context.
The new The incidence of drought-related stress was higher among farmers who were younger, living and working on a farm, located in geographically remote areas, and experiencing financial hardship.
The implications Clarifying the relationship between drought, drought-related stress, and factors that modulate this stress will create opportunities for promoting adaptation by rural populations to climate adversity and for improving mental health support by general practitioners for farmers experiencing drought-related stress.
Drought and other extreme climate events threaten public health around the world.1 The biophysical impacts of drought are intertwined with social and structural factors, exposing different social and demographic groups in diverse geographic locations to a variety of risks and sensitivities.2 Australian rural communities are vulnerable to the socio-economic impacts of drought because they rely on primary production and water-intensive industries,3,4 as well as to the health effects associated with difficulties in accessing health care.5
Prolonged drought may pose risks to both physical and mental health.1 Specific rural occupational health risks (eg, financial hardship) and moderating socio-demographic factors (eg, social capital) have been identified,1 as well as the impact of drought on social networks,6 which have been identified as being key modulators of mental health in rural communities,7 including among people in farming.8 Associations between suicide in rural areas and drought,9 socio-economic hardship,10 and financial strain among farmers11 have been reported. One investigation of the 2001–2007 Victorian drought did not detect such an association, but was limited by its short duration and the small number of relevant cases; its author suggested that drought should still be considered a suicide risk factor for farmers.12 Drought has also been linked with reduced help-seeking behaviour and unemployment.13
Moderate to high psychological distress among farmers,14 including drought as a source of stress,15 has been reported. One study,14 while acknowledging that a large proportion of the farming population are men, did not specifically examine sex as a factor. The association between drought and mental health in women in drought-affected areas is not well researched.16
Quantifying the impact of drought on the mental health of farmers and the factors mediating these effects are largely unexplored. Few epidemiological studies have examined specific drought characteristics as predictors of mental health outcomes,17 particularly in farming populations. Additionally, there has been little empirical research into the effects of long term climatic extremes such as drought, as investigations are usually focused on short term events such as floods and bushfires.
We therefore analysed data from the Australian Rural Mental Health Study (ARMHS), a longitudinal cohort investigation of the determinants of mental health in non-metropolitan New South Wales. Data were collected during 2007–2013, a period that included the Millennium Drought (1997–2010), which caused severe environmental, social, and economic losses.18
Our aim was to explore general and drought-related stress experienced by farmers at both the personal and community levels, and to establish whether socio-demographic and community factors influence this stress. The ARMHS dataset provides a unique resource for examining these factors, as data on a range of rural-specific personal, social and community factors were collected repeatedly during a period that included both dry and wet conditions. Our study built on previous analyses of cross-sectional data that assessed the perceived community and personal impacts of drought longitudinally.8
Methods
Setting and participants
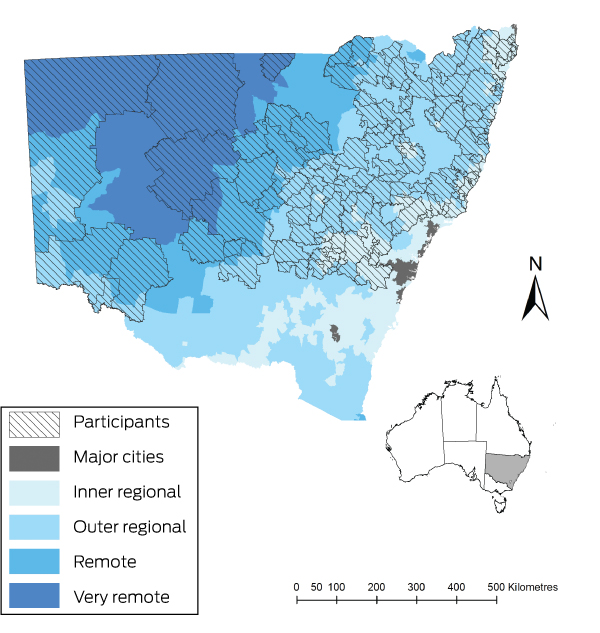
The ARMHS was conducted in non-metropolitan NSW as defined by the Australian Standard Geographic Classification (ASGC) using Accessibility/Remoteness Index of Australia (ARIA+) (Box 1).19 There were four waves of data collection during January 2007 – August 2013. Follow-ups at 1, 3 and 5 years consisted of single surveys, with an additional Water and Climate survey at 3 years. Three of the four ARMHS waves that included drought-related stress measures were analysed (baseline, 3- and 5-year follow-ups).
The study population comprised the subset of ARMHS participants who lived or worked on a farm (“farmers”). Living on a farm was determined by asking, “Do you currently live on a farm?” Participants were deemed to work on a farm if their self-reported occupation was categorised by the Australian and New Zealand Standard Classification of Occupations20 as “farmers and farm managers” or “farm, forestry and garden workers”. To maximise the generalisability of our findings, we back-weighted our data to adjust for the geographic distribution of farmers in Australia; that is, we gave slightly less value to inner regional and slightly more to remote and very remote areas. Participants who did not provide a postcode or who resided in a postcode outside NSW were excluded, as were those who moved to a major city between survey waves or for whom data were incomplete. Data recorded included self-reported measures of current and past physical and mental health, health service use, and common determinants of mental health.21
Definition of drought
As the impacts of drought vary significantly by place and time, spatial analysis is required. Each of the four main types of drought (meteorological, agricultural, ecological and hydrological) influence environmental and socio-economic conditions in a unique manner.18 More than 100 drought indices are available, but there is no consensus about which is most appropriate for a given circumstance.22 In our investigation, we applied a simple measure of “meteorological drought”, distinguishing between wet (non-drought) and dry conditions, as all types of drought are influenced by rainfall deficiencies.18
Drought conditions were assessed by comparing rainfall during the 12 months preceding the month in which a survey was completed with the long term average (1900–2016). For example, if the participant completed the survey in March 2008, mean monthly rainfall for March 2007 – February 2008 was expressed as a proportion of the long term average for March–February. Twelve months was chosen as the window to accommodate the time between ARMHS survey waves.
Outcome measures
The three primary outcome measures were personal drought-related stress (PDS), community drought-related stress (CDS), and general psychological distress. PDS and CDS are novel ARMHS measures developed on the basis of initial qualitative research6 and rural community consultation during the development of the ARMHS study. Respondents were asked to rate their level of worry or stress about drought (single Likert scale item). Those who reported experiencing worry or stress were asked to indicate whether they had experienced specific drought-linked effects related to PDS and CDS. The PDS consists of six items, the CDS of five. Scores were generated by counting the number of “yes” responses (no weighting). General psychological distress was assessed with the Kessler Psychological Distress Scale (K10),23 a 10-item measure of general distress during the previous 4 weeks.
Further potential factors
Other potential factors — including neuroticism, adverse life events, social support, marital status, sense of community, and remoteness — relevant to the rural context and shown to contribute to drought-related stress and psychological distress were also assessed7,8 (Box 2).
Statistical analysis
Data were analysed in SPSS 24 (IBM). The primary method of data analysis was multivariate linear regression in the generalised estimating equations (GEE) framework. A negative binomial model with log link and multivariate adjustments was applied. This method is considered ideal for longitudinal analyses of data collected at multiple time points from the same participants.27 Separate GEEs including drought and the other factors described above were calculated for each of the outcomes (PDS, CDS, K10). Exponentiated estimates from the models may be interpreted as incidence rate ratios (IRRs). Statistical significance was defined as the 95% confidence interval [CI] for the IRR not including 1.0.
Ethics approval
The study was approved by the Human Research Ethics Committee at the University of Newcastle (reference, H-145-1105a).
Results
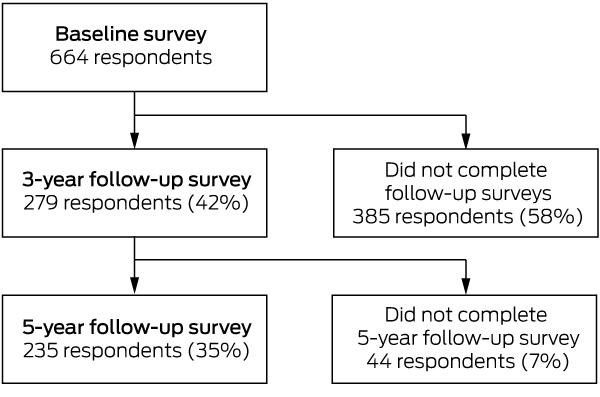
The ARMHS sample selection process and characteristics have been reported previously.21 In brief, of 13 251 individuals invited to participate in the initial survey, 9681 individuals were deemed eligible; of these 2639 (from 1879 households) consented and completed the baseline survey (response rate, 27%). Our study population comprised at baseline 664 participants (473 households) who identified as living and/or working on a farm, and there were 1178 total responses across the three study waves (Box 3). Compared with participants who completed the baseline survey (Box 4), those who completed at least one follow-up survey were less likely to be aged 18–34 years (76% attrition rate; P = 0.015) and to work but not live on a farm (75% attrition rate; P = 0.042). Other demographic characteristics were statistically similar (data not shown).
The three major outcomes were found to be independent, with weak correlations between K10 scores and PDS (r = 0.25; P < 0.001) and CDS (r = 0.17; P < 0.001). The correlation between PDS and CDS was moderate (r = 0.66; P < 0.001).
The proportions of participants who experienced elements of PDS or CDS are shown in Box 5. Those who both lived and worked on a farm reported higher PDS (IRR, 1.50; 95% CI, 1.32–1.72) than those who only lived or only worked on a farm (Box 6); the differences for CDS and K10 were not significant. Our findings were similar for both unweighted and back-weighted data.
In the weighted model, the incidence of PDS was lower following mild wet periods (compared with average rainfall: IRR, 0.85; 95% CI, 0.73–0.99) and that of psychological distress was higher (IRR, 1.65; 95% CI, 1.01–2.69). The incidence of CDS was significantly increased by moderate dry (IRR, 1.26; 95% CI, 1.05–1.50) and moderate wet weather (IRR, 1.27; 95% CI, 1.03–1.57), and reduced by mild wet weather (IRR, 0.84; 95% CI, 0.72–0.97) (Box 6). Postcode areas in which average CDS was equal to or above the average (2.5) for total CDS by drought condition are depicted in the online Appendix, figure 1. No participants experienced “extreme dry” conditions during the study period.
Sex was not significantly related to drought-related stress, but men experienced significantly greater psychological distress. In contrast, 18–34-year-old farmers reported higher PDS and CDS scores than older respondents. The incidence of psychological distress was also significantly lower for participants aged 55 or more (Box 6).
The incidence of PDS was lower among retired than employed participants, and both PDS and psychological distress were lower among “prosperous” or “very comfortable” participants than for less financially secure respondents. Having experienced 4–6 adverse life events was associated with greater PDS, CDS and psychological distress. Never having married was associated with less PDS (Box 6).
Compared with inner regional areas, PDS was greater for participants in outer regional (IRR, 1.88; 95% CI, 1.59–2.23), remote (IRR, 2.02; 95% CI, 1.65–2.48) and very remote (IRR, 2.55; 95% CI, 1.97–3.30) areas. Similarly, CDS was greater in outer regional (IRR, 2.05; 95% CI, 1.76–2.38), remote (IRR, 2.17; 95% CI, 1.83–2.58) and very remote (IRR, 2.80; 95% CI, 2.26–3.47) areas than in inner regional areas, but general psychological distress was not influenced by remoteness (Box 6). Postcode areas in which average CDS was equal to or above the average (2.5) for total CDS are depicted by remoteness class in online Appendix, figure 2. Sense of place and of community did not influence PDS or CDS, but greater sense of community was associated with reduced general distress.
Higher trait neuroticism was associated with greater psychological distress, while good, very good or excellent overall mental health and relationships were associated with lower general distress (Box 6).
Discussion
Farmers who were under 35, both lived and worked on a farm, experienced greater financial hardship, and were in outer regional, remote or very remote NSW more frequently reported drought-related stress. This stress included worry about the impacts of drought on themselves and on their families and communities, and was influenced by socio-demographic and community factors that were different from the factors that influenced the incidence of general psychological distress. An earlier analysis of baseline cross-sectional ARMHS data found that only 9.8% of respondents in areas of high drought exposure with high levels of drought-related concerns had high K10 scores.8
Young people in rural communities are a vulnerable group with regard to mental health. It has been reported27 that unemployed young people in rural and remote NSW were 12 times as likely to experience distress as employed people of the same age after controlling for financial security, sex, and relationship status. Younger people in rural areas are more likely to experience constriction of their social network as peers relocate for employment and educational opportunities.28 Our findings underscore the importance of employment and social networks as protective factors for farmers in drought-affected areas. Understanding the relationship between drought, distress, and young people will enable programs and initiatives for promoting mental health among farmers to be targeted.
Moderately dry, mild dry, and moderately wet conditions were related to higher incidence of CDS, while mild wet conditions were associated with greater incidence of all three outcomes. The association between higher levels of drought-related stress and wet conditions is possibly related to much of the study area receiving high rainfall during September–November 2010, and suggests drought-related stress persists beyond the end of the drought.
The incidence of PDS was significantly greater for farmers who both lived and worked on a farm than for those who only worked or lived on one. For farmers, work and home are intimately linked, and drought adds another layer of complexity to their occupational, financial, community and personal stressors. The influence of adverse life events on PDS and CDS is consistent with drought compounding existing stress or contributing to adverse events — such as illness or injury to oneself or a close relative, marital separation, unemployment, and major financial crisis3 — by causing financial hardship, relationship strain, and risk of injury related to taking on physical tasks following the loss of other farm workers.6
Isolation further complicates the rural experience, with increased remoteness related to higher incidence of PDS and CDS. Remote areas experience drought more frequently than urban areas, as well as facing greater challenges related to water availability.3,4,18 Remoteness also affects the social networks that are essential for resilience and capacity building.15
Lower financial security was associated with higher incidence of PDS. Rural areas are experiencing increased demand for social security support,3 but many people do not seek financial assistance because of the perceived stigma associated with support and their qualities of resilience and stoicism. In the course of previous studies in rural and remote areas,3,4 we consistently heard that reduced financial security, lower resilience, and the pressures of family and relationships had a greater impact on younger and newer farmers.
Our findings regarding the differences in factors that influence PDS, CDS and general distress confirm previous cross-sectional analyses of baseline drought items data;8 that is, drought-related stress may contribute to general psychological distress, but is distinguishable from it.8 The slow onset of the impact of drought contrasts with the immediate effects of extremes such as cyclones and floods. Investigation of modulators of drought-related stress could inform community-based strategies for alleviating stress, promote drought preparedness, and guide community and government agencies providing support for people in rural areas.29 General practitioners are in a unique position to contribute to programs and initiatives for relieving stress related to climate adversity and for supporting farmers experiencing stress.30 Educating general practitioners about drought and stress in farming communities, as well as about practical approaches to supporting farmer health and safety, is critical.29
Limitations
Study limitations include our application of a meteorological definition of drought. The impact of other types of drought (hydrological, agricultural) on drought-related stress among farmers should also be examined. The effects of different drought durations and the fluctuation between wet and dry epochs should also be investigated. Another limitation was that it was difficult to identify people who do not live on farms but had lost farm employment because of drought, exacerbating the consequences for rural communities of the financial and social impact of drought.
Conclusion
Farmers in NSW experience significant stress related to the impact of drought. Farmers who live and work on a farm, are younger, have less financial security, or are located remotely require particular support. Improving the mental health of farmers may enhance their adaptive capacity and resilience. We did not identify sex differences in PDS and CDS, but differences in the manner in which men and women seek help, discuss and understand problems, and engage in support networks and services should nonetheless be considered by initiatives for relieving drought-related stress.5 Programs of support for drought-affected communities should incorporate an understanding of the relationship between drought and mental health, and take factors into account that influence PDS and CDS.
Box 1 – Location of the study participants by postcode and Australian Standard Geographic Classification remoteness class
Box 2 – Measures of factors that potentially influence stress in people in rural communities
|
Factor |
Measure |
||||||||||||||
|
|
|||||||||||||||
|
Self-reported demographic information: age, sex, marital status, employment status, education, financial position |
|
||||||||||||||
|
Self-rating of overall physical health, mental health, and relationships |
Five-point Likert scale, from “poor” to “excellent” |
||||||||||||||
|
Personality (predisposition to distress) |
Validated seven-item neuroticism subscale of the Eysenck Personality Questionnaire, short form (EPQN)8 |
||||||||||||||
|
Adverse life events during previous 12 months |
List of Threatening Experiences24 |
||||||||||||||
|
Connectedness to the local community (feeling that members belong and are important, and that their needs will be met through their commitment to the community) |
|||||||||||||||
|
|
|||||||||||||||
|
|
|||||||||||||||
Box 4 – Socio-demographic characteristics of the study participants at baseline
|
Characteristic |
Participants |
||||||||||||||
|
|
|||||||||||||||
|
Total number of participants |
664 |
||||||||||||||
|
Farm status |
|
||||||||||||||
|
Live and work |
200 (28.4%) |
||||||||||||||
|
Live |
439 (67.9%) |
||||||||||||||
|
Work |
25 (3.6%) |
||||||||||||||
|
Sex |
|
||||||||||||||
|
Women |
374 (56.3%) |
||||||||||||||
|
Men |
290 (43.7%) |
||||||||||||||
|
Age (years) |
|
||||||||||||||
|
18–34 |
66 (9.9%) |
||||||||||||||
|
35–44 |
127 (13.1%) |
||||||||||||||
|
45–54 |
161 (24.2%) |
||||||||||||||
|
55–64 |
184 (27.7%) |
||||||||||||||
|
65 or older |
126 (19.0%) |
||||||||||||||
|
Employment |
|
||||||||||||||
|
Employed/home duties/studying |
540 (80.5%) |
||||||||||||||
|
Unemployed/unable to work |
24 (3.9%) |
||||||||||||||
|
Retired |
100 (15.6%) |
||||||||||||||
|
Financial security |
|
||||||||||||||
|
Prosperous/very comfortable |
86 (15%) |
||||||||||||||
|
Reasonably comfortable |
371 (49.0%) |
||||||||||||||
|
Just getting along/poor/very poor |
207 (36.0%) |
||||||||||||||
|
Education |
|
||||||||||||||
|
Completed school |
|
||||||||||||||
|
Partial schooling |
182 (27.4%) |
||||||||||||||
|
Completed high school or higher |
451 (67.9%) |
||||||||||||||
|
Unknown |
31 (4.7%) |
||||||||||||||
|
Marital status |
|
||||||||||||||
|
Married/de facto |
547 (82.5%) |
||||||||||||||
|
Separated/divorced |
37 (5.6%) |
||||||||||||||
|
Widow |
28 (4.1%) |
||||||||||||||
|
Never married |
52 (7.8%) |
||||||||||||||
|
Remoteness (Australian Standard Geographic Classification) |
|||||||||||||||
|
Inner regional |
276 (41.6%) |
||||||||||||||
|
Outer regional |
323 (48.6%) |
||||||||||||||
|
Remote |
49 (7.4%) |
||||||||||||||
|
Very remote |
16 (2.4%) |
||||||||||||||
|
|
|||||||||||||||
|
|
|||||||||||||||
Box 5 – Proportions of participants who experienced items of personal or community drought-related stress
|
|
|||||||||||||||
|
Personal drought-related stress (PDS) |
|
||||||||||||||
|
Has drought had any of these effects on you and your family? |
|||||||||||||||
|
Money/financial pressures |
602 (57.3%) |
||||||||||||||
|
Business pressures |
522 (49.4%) |
||||||||||||||
|
Loss of contact with friends |
173 (16.4%) |
||||||||||||||
|
Not going out as much |
357 (33.9%) |
||||||||||||||
|
More work to do |
535 (50.7%) |
||||||||||||||
|
Less time for family |
295 (28.1%) |
||||||||||||||
|
PDS score,* mean (SD) |
2.1 (2.4) |
||||||||||||||
|
Community drought-related stress (CDS) |
|
||||||||||||||
|
Has drought had any of these effects on the district where you live? |
|||||||||||||||
|
People leaving the area |
497 (45.2%) |
||||||||||||||
|
Losing business and services in town |
509 (46.0%) |
||||||||||||||
|
Not getting together as much |
392 (35.6%) |
||||||||||||||
|
Countryside has changed |
667 (60.2%) |
||||||||||||||
|
Reduced water quality |
483 (43.8%) |
||||||||||||||
|
CDS score,* mean (SD) |
1.9 (2.3) |
||||||||||||||
|
|
|||||||||||||||
|
SD = standard deviation. * Individual items were summed to give total scores. |
|||||||||||||||
Box 6 – Socio-demographic and drought conditions affecting drought-related stress and general psychological distress in farmers in rural New South Wales
|
|
Personal drought-related stress |
Community drought-related stress |
Psychological distress (K10) |
||||||||||||
|
Unweighted |
Weighted |
Unweighted |
Weighted |
Unweighted |
Weighted |
||||||||||
|
IRR (95% CI) |
IRR (95% CI) |
IRR (95% CI) |
IRR (95% CI) |
IRR (95% CI) |
IRR (95% CI) |
||||||||||
|
|
|||||||||||||||
|
Farmer status |
|
|
|
|
|
|
|||||||||
|
Live on farm |
1 |
1 |
1 |
1 |
1 |
1 |
|||||||||
|
Work on farm |
0.99 (0.67–1.48) |
0.90 (0.62–1.3) |
1.11 (0.80–1.52) |
1.03 (0.77–1.38) |
1.31 (0.34–5.08) |
1.24 (0.37–4.13) |
|||||||||
|
Live and work on farm |
1.55 (1.35–1.78) |
1.50 (1.32–1.72) |
1.08 (0.94–1.24) |
1.06 (0.93–1.21) |
1.13 (0.64–2.00) |
1.21 (0.70–2.10) |
|||||||||
|
Drought condition (rainfall during 12 months prior to survey as proportion of long term average [1900–2016]) |
|||||||||||||||
|
Moderate dry (> 30–60%) |
1.01 (0.79–1.28) |
1.02 (0.82–1.28) |
1.30 (1.07–1.57) |
1.26 (1.05–1.50) |
4.55 (0.55–38.0) |
3.87 (0.50–29.7) |
|||||||||
|
Mild dry (> 60–90%) |
0.99 (0.84–1.16) |
0.98 (0.84–1.14) |
1.18 (1.03–1.35) |
1.14 (1.00–1.30) |
0.90 (0.54–1.52) |
0.95 (0.57–1.57) |
|||||||||
|
Average (> 90–120%) |
1 |
1 |
1 |
1 |
1 |
1 |
|||||||||
|
Mild wet (> 120–150%) |
0.85 (0.72–1.00) |
0.85 (0.73–0.99) |
0.87 (0.74–1.02) |
0.84 (0.72–0.97) |
1.59 (0.96–2.64) |
1.65 (1.01–2.69) |
|||||||||
|
Moderate wet (> 150–180%) |
0.92 (0.69–1.23) |
0.95 (0.72–1.25) |
1.27 (1.02–1.59) |
1.27 (1.03–1.57) |
0.71 (0.36–1.39) |
0.87 (0.43–1.73) |
|||||||||
|
Extreme wet (> 180%) |
0.86 (0.64–1.16) |
0.79 (0.59–1.05) |
1.18 (0.97–1.43) |
1.08 (0.89–1.31) |
1.19 (0.45–3.11) |
0.99 (0.40–2.46) |
|||||||||
|
Sex |
|
|
|
|
|
|
|||||||||
|
Men |
1 |
1 |
1 |
1 |
1 |
1 |
|||||||||
|
Women |
1.12 (0.96–1.31) |
1.09 (0.94–1.27) |
1.09 (0.95–1.26) |
1.07 (0.93–1.22) |
0.57 (0.35–0.94) |
0.58 (0.36–0.95) |
|||||||||
|
Age (years) |
|
|
|
|
|
|
|||||||||
|
18–34 |
1 |
1 |
1 |
1 |
1 |
1 |
|||||||||
|
35–44 |
0.71 (0.56–0.91) |
0.71 (0.56–0.89) |
0.71 (0.57–0.89) |
0.72 (0.58–0.89) |
1.20 (0.41–3.51) |
1.02 (0.36–2.90) |
|||||||||
|
45–54 |
0.57 (0.46–0.72) |
0.56 (0.45–0.70) |
0.66 (0.53–0.83) |
0.66 (0.54–0.82) |
0.39 (0.15–1.03) |
0.39 (0.15–1.00) |
|||||||||
|
55–64 |
0.58 (0.46–0.73) |
0.57 (0.46–0.71) |
0.67 (0.54–0.84) |
0.68 (0.55–0.85) |
0.24 (0.09–0.65) |
0.25 (0.10–0.67) |
|||||||||
|
65 or older |
0.60 (0.45–0.80) |
0.60 (0.46–0.77) |
0.62 (0.48–0.82) |
0.62 (0.48–0.80) |
0.19 (0.06–0.57) |
0.19 (0.07–0.56) |
|||||||||
|
Employment |
|
|
|
|
|
|
|||||||||
|
Employed/home duties/studying |
1 |
1 |
1 |
1 |
1 |
1 |
|||||||||
|
Unemployed/unable to work |
0.88 (0.59–1.31) |
0.87 (0.58–1.29) |
1.06 (0.76–1.48) |
1.05 (0.75–1.46) |
4.87 (0.94–25.2) |
5.29 (1.03–27.2) |
|||||||||
|
Retired |
0.68 (0.52–0.89) |
0.66 (0.51–0.86) |
0.88 (0.70–1.11) |
0.86 (0.69–1.07) |
0.76 (0.39–1.48) |
0.75 (0.39–1.43) |
|||||||||
|
Financial security |
|
|
|
|
|
|
|||||||||
|
Prosperous/very comfortable |
1 |
1 |
1 |
1 |
1 |
1 |
|||||||||
|
Reasonably comfortable |
1.32 (1.06–1.64) |
1.30 (1.05–1.60) |
1.07 (0.90–1.28) |
1.07 (0.91–1.27) |
1.19 (0.70–2.02) |
1.12 (0.67–1.90) |
|||||||||
|
Just getting along/poor/very poor |
1.74 (1.39–2.18) |
1.72 (1.38–2.14) |
1.14 (0.95–1.38) |
1.15 (0.96–1.38) |
3.22 (1.62–6.40) |
2.99 (1.52–5.89) |
|||||||||
|
Adverse life events |
|
|
|
|
|
|
|||||||||
|
0 |
1 |
1 |
1 |
1 |
1 |
1 |
|||||||||
|
1–3 |
1.14 (0.98–1.32) |
1.11 (0.96–1.28) |
1.19 (1.05–1.36) |
1.18 (1.04–1.33) |
1.59 (1.08–2.35) |
1.63 (1.11–2.38) |
|||||||||
|
4–6 |
1.39 (1.11–1.74) |
1.34 (1.08–1.66) |
1.26 (1.02–1.55) |
1.23 (1.01–1.51) |
6.76 (2.32–19.7) |
6.33 (2.27–17.6) |
|||||||||
|
7–9 |
1.89 (0.93–3.85) |
1.70 (0.87–3.32) |
0.95 (0.46–1.99) |
0.99 (0.53–1.87) |
6.14 (0.33–115) |
3.81 (0.23–63.0) |
|||||||||
|
Education |
|
|
|
|
|
|
|||||||||
|
Completed school |
|
|
|
|
|
|
|||||||||
|
Partial schooling |
1 |
1 |
1 |
1 |
1 |
1 |
|||||||||
|
Completed high school or higher |
1.02 (0.87–1.19) |
1.03 (0.88–1.19) |
1.00 (0.86–1.16) |
1.00 (0.87–1.15) |
0.86 (0.46–1.59) |
0.91 (0.49–1.66) |
|||||||||
|
Unknown |
1.00 (0.62–1.63) |
1.06 (0.69–1.63) |
0.96 (0.69–1.34) |
0.98 (0.73–1.31) |
0.59 (0.15–2.39) |
0.86 (0.22–3.31) |
|||||||||
|
Marital status |
|
|
|
|
|
|
|||||||||
|
Married/de facto |
1 |
1 |
1 |
1 |
1 |
1 |
|||||||||
|
Separated/divorced |
1.06 (0.75–1.49) |
1.03 (0.75–1.42) |
1.00 (0.72–1.40) |
1.00 (0.74–1.36) |
1.21 (0.37–3.97) |
1.12 (0.37–3.44) |
|||||||||
|
Widow |
1.03 (0.67–1.57) |
1.12 (0.76–1.63) |
0.99 (0.67–1.46) |
1.03 (0.73–1.47) |
2.22 (0.82–6.02) |
2.45 (0.91–6.60) |
|||||||||
|
Never married |
0.71 (0.53–0.95) |
0.68 (0.52–0.89) |
0.82 (0.62–1.08) |
0.82 (0.63–1.06) |
0.61 (0.20–1.90) |
0.63 (0.21–1.90) |
|||||||||
|
Remoteness (Australian Standard Geographic Classification) |
|||||||||||||||
|
Inner regional |
1 |
1 |
1 |
1 |
1 |
1 |
|||||||||
|
Outer regional |
1.88 (1.59–2.22) |
1.88 (1.59–2.23) |
2.04 (1.76–2.38) |
2.05 (1.76–2.38) |
1.37 (0.81–2.31) |
1.40 (0.83–2.35) |
|||||||||
|
Remote |
2.02 (1.58–2.58) |
2.02 (1.65–2.48) |
2.16 (1.77–2.63) |
2.17 (1.83–2.58) |
0.76 (0.29–1.99) |
0.83 (0.39–1.78) |
|||||||||
|
Very remote |
2.50 (1.93–3.24) |
2.55 (1.97–3.30) |
2.75 (2.22–3.40) |
2.80 (2.26–3.47) |
3.23 (0.18–59.4) |
3.64 (0.20–66.8) |
|||||||||
|
Sense of place |
|
|
|
|
|
|
|||||||||
|
Below median |
1 |
1 |
1 |
1 |
1 |
1 |
|||||||||
|
Median or above |
1.00 (0.87–1.17) |
0.98 (0.86–1.13) |
1.07 (0.94–1.22) |
1.05 (0.93–1.19) |
1.66 (1.00–2.75) |
1.58 (0.97–2.58) |
|||||||||
|
Sense of community |
|
|
|
|
|
|
|||||||||
|
Below median |
1 |
1 |
1 |
1 |
1 |
1 |
|||||||||
|
Median or above |
0.95 (0.82–1.09) |
0.96 (0.84–1.10) |
0.99 (0.87–1.13) |
1.01 (0.89–1.13) |
0.33 (0.19–0.56) |
0.33 (0.19–0.55) |
|||||||||
|
Overall physical health |
|
|
|
|
|
|
|||||||||
|
Poor/fair |
1 |
1 |
1 |
1 |
1 |
1 |
|||||||||
|
Good/very good/excellent |
1.00 (0.83–1.21) |
1.03 (0.86–1.24) |
1.01 (0.87–1.17) |
1.03 (0.89–1.18) |
0.38 (0.18–0.83) |
0.41 (0.20–0.85) |
|||||||||
|
Overall mental health |
|
|
|
|
|
|
|||||||||
|
Poor/fair |
1 |
1 |
1 |
1 |
1 |
1 |
|||||||||
|
Good/very good/excellent |
1.02 (0.82–1.28) |
0.98 (0.79–1.21) |
0.87 (0.72–1.05) |
0.85 (0.71–1.01) |
0.01 (0.00–0.03) |
0.01 (0.00–0.03) |
|||||||||
|
Overall relationships |
|
|
|
|
|
|
|||||||||
|
Poor/fair |
1 |
1 |
1 |
1 |
1 |
1 |
|||||||||
|
Good/very good/excellent |
0.85 (0.65–1.10) |
0.83 (0.65–1.06) |
0.99 (0.81–1.23) |
1.01 (0.83–1.23) |
0.11 (0.02–0.56) |
0.11 (0.02–0.52) |
|||||||||
|
Trait neuroticism: EPQN score, per one-point increase in score |
1.02 (0.98–1.07) |
1.02 (0.98–1.07) |
1.00 (0.96–1.05) |
1.00 (0.96–1.05) |
2.16 (1.76–2.64) |
2.15 (1.77–2.62) |
|||||||||
|
|
|||||||||||||||
|
CI = confidence interval; EPQN = neuroticism subscale of the Eysenck Personality Questionnaire, short form; IRR = incidence rate ratio. Total number of respondents: 664; total number of responses, 1178. Analysis was adjusted for study phase, participant identification, and household identification, and for other factors in table. |
|||||||||||||||
Received 5 December 2017, accepted 30 April 2018
- Emma K Austin1
- Tonelle Handley2,3
- Anthony S Kiem1
- Jane L Rich3,4
- Terry J Lewin3,5
- Hedda H Askland6
- Sara S Askarimarnani1
- David A Perkins2
- Brian J Kelly3
- 1 Centre for Water, Climate and Land, University of Newcastle, Newcastle, NSW
- 2 Centre for Rural and Remote Mental Health, University of Newcastle, Orange, NSW
- 3 University of Newcastle, Newcastle, NSW
- 4 Centre for Resources Health and Safety, University of Newcastle, Newcastle, NSW
- 5 Hunter New England Mental Health, Newcastle, NSW
- 6 Centre for Social Research and Regional Futures, University of Newcastle, Newcastle, NSW
We are grateful to the ARMHS participants for contributing their time to the study. The ARMHS was funded by the National Health and Medical Research Council (401241, 631061), and was also supported by the Australian Rural Health Research Collaboration. Emma Austin was supported by an Australian Government Research Training Program Scholarship. We thank Olivier Rey-Lescure (University of Newcastle) for technical assistance with mapping.
No relevant disclosures.
- 1. Stanke C, Kerac M, Prudhomme C, et al. Health effects of drought: a systematic review of the evidence. PLoS Curr 2013; 5: doi: 10.1371/currents.dis.7a2cee9e980f91ad7697b570bcc4b004.
- 2. Otto IM, Reckien D, Reyer CPO, et al. Social vulnerability to climate change: a review of concepts and evidence. Reg Environ Change 2017; 17: 1651-1662.
- 3. Kiem AS, Austin EK. Drought and the future of rural communities: opportunities and challenges for climate change adaptation in regional Victoria, Australia. Global Environ Change 2013; 23: 1307-1316.
- 4. Kiem AS. Drought and water policy in Australia: challenges for the future illustrated by the issues associated with water trading and climate change adaptation in the Murray–Darling Basin. Global Environ Change 2013; 23: 1615-1626.
- 5. Handley TE, Kay-Lambkin FJ, Inder KJ, et al. Self-reported contacts for mental health problems by rural residents: predicted service needs, facilitators and barriers. BMC Psychiatry 2014; 14: 1-12.
- 6. Sartore GM, Kelly B, Stain H, et al. Control, uncertainty, and expectations for the future: a qualitative study of the impact of drought on a rural Australian community. Rural Remote Health 2008; 8: 950.
- 7. Kelly B, Lewin T, Stain H, et al. Determinants of mental health and well-being within rural and remote communities. Soc Psychiatry Psychiatr Epidemiol 2011; 46: 1331-1342.
- 8. Stain HJ, Kelly B, Carr VJ, et al. The psychological impact of chronic environmental adversity: responding to prolonged drought. Soc Sci Med 2011; 73: 1593-1599.
- 9. Hanigan IC, Butler CD, Kokic PN, Hutchinson MF. Suicide and drought in New South Wales, Australia, 1970–2007. Proc Natl Acad Sci U S A 2012; 109: 13950-13955.
- 10. Taylor R, Page A, Morrell S, et al. Social and psychiatric influences on urban–rural differentials in Australian suicide. Suicide Life Threat Behav 2005; 35: 277-290.
- 11. Page AN, Fragar LJ. Suicide in Australian farming, 1988–1997. Aust N Z J Psychiatry 2002; 36: 81-85.
- 12. Guiney R. Farming suicides during the Victorian drought: 2001–2007. Aust J Rural Health 2012; 20: 11-15.
- 13. Alston M, Kent J. The big dry: the link between rural masculinities and poor health outcomes for farming men. J Sociol 2008; 44: 133-147.
- 14. Fragar L, Stain HJ, Perkins D, et al. Distress among rural residents: does employment and occupation make a difference? Aust J Rural Health 2010; 18: 25-31.
- 15. Stain HJ, Kelly B, Lewin TJ, et al. Social networks and mental health among a farming population. Soc Psychiatry Psychiatr Epidemiol 2008; 43: 843-849.
- 16. Powers JR, Dobson AJ, Berry HL, et al. Lack of association between drought and mental health in a cohort of 45–61 year old rural Australian women. Aust N Z J Public Health 2015; 39: 518-523.
- 17. O’Brien LV, Berry HL, Coleman C, Hanigan IC. Drought as a mental health exposure. Environ Res 2014; 131: 181-187.
- 18. Kiem AS, Johnson F, Westra S, et al. Natural hazards in Australia: droughts. Clim Change 2016; 139: 37-54.
- 19. Australian Bureau of Statistics. Australian Standard Geographical Classification (ASGC). Updated June 2014. http://www.abs.gov.au/websitedbs/D3310114.nsf/home/Australian+Standard+Geographical+Classification+(ASGC) (viewed June 2018).
- 20. Australian Bureau of Statistics. 1220.0. ANZSCO — Australian and New Zealand Standard Classification of Occupations, first edition, revision 1. June 2009. http://www.abs.gov.au/AUSSTATS/abs@.nsf/DetailsPage/1220.0First%20Edition,%20Revision%201?OpenDocument (viewed June 2018).
- 21. Kelly BJ, Stain HJ, Beard JR, et al. Mental health and well-being within rural communities: the Australian Rural Mental Health Study. Aust J Rural Health 2010; 18: 16-24.
- 22. Zargar A, Sadiq R, Naser B, Khan FI. A review of drought indices. Environ Rev 2011; 19: 333-349.
- 23. Kessler RC, Andrews G, Colpe LJ, et al. Short screening scales to monitor population prevalences and trends in non-specific psychological distress. Psychol Med 2002; 32: 959-976.
- 24. Brugha TS, Cragg D. The List of Threatening Experiences: the reliability and validity of a brief life events questionnaire. Acta Psychiatr Scand 1990; 82: 77-81.
- 25. Chipuer HM, Pretty GMH. A review of the Sense of Community Index: current uses, factor structure, reliability, and further development. J Community Psychol 1999; 27: 643-658.
- 26. Higginbotham N, Connor L, Albrecht G, et al. Validation of an Environmental Distress Scale. Ecohealth 2006; 3: 245-254.
- 27. Inder K, Holliday E, Handley T, et al. Depression and risk of unintentional injury in rural communities — a longitudinal analysis of the Australian Rural Mental Health Study. Int J Environ Res Public Health 2017; 14: 1080.
- 28. Handley T, Davies K, Rich J, Perkins D. Understanding the mental health of rural young adults: risk and protective factors. Int J Ment Health Psychiatry 2017; 3: doi: 10.4172/2471-4372.1000154.
- 29. Fragar L, Kelly B, Peters M, et al. Partnerships to promote mental health of NSW farmers: the New South Wales Farmers Blueprint for Mental Health. Aust J Rural Health 2008; 16: 170-175.
- 30. Blashki G, Abelsohn A, Woollard R, et al. General practitioners’ responses to global climate change — lessons from clinical experience and the clinical method. Asia Pac Fam Med 2012; 11: 6.
Abstract
Objectives: To investigate general and drought-related stress experienced by farmers at both the personal and community levels, and whether socio-demographic and community factors influence this stress.
Design: Multivariate analysis of data from the Australian Rural Mental Health Study (ARMHS), a longitudinal cohort study (2007–2013).
Setting: Non-metropolitan New South Wales.
Participants: Subset of 664 ARMHS participants (at baseline) who identified as living or working on a farm.
Main outcome measures: Personal drought-related stress (PDS), community drought-related stress (CDS), and general psychological distress (K10 score).
Results: Farmers who were under 35, both lived and worked on a farm, experienced greater financial hardship, and were in outer regional, remote or very remote NSW reported PDS particularly frequently. Of these factors, only being under 35 and increased remoteness were associated with higher incidence of CDS. Mild wet weather during the prior 12 months reduced PDS and CDS but increased general distress. Moderate or extreme wet weather did not affect PDS or general distress, but moderate wet weather was associated with increased CDS. Drought-related stress and general psychological distress were influenced by different socio-demographic and community factors.
Conclusions: Farmers in NSW experience significant stress about the effects of drought on themselves, their families, and their communities. Farmers who are younger, live and work on a farm, experience financial hardship, or are isolated are at particular risk of drought-related stress. Medical practitioners who provide assistance to farmers and farming communities can contribute to initiatives that relieve stress about drought.