


Has alcohol consumption in Australia increased in recent years?
Estimating the consumption of alcohol by individuals and societies is notoriously difficult, especially as it frequently relies on self-reported data. Much depends on the quality of the data-gathering instrument, the questions asked, and the veracity of the survey sample.
The Australian Bureau of Statistics (ABS) conducts periodic health surveys to collect information on the health of Australians, including data on their alcohol consumption. The 2001 National Health Survey1 was the first for which the ABS made the confidentialised unit record files available, enabling researchers to undertake detailed data analyses. Further health surveys were conducted in 2004–2005, 2007–2008 and most recently in 2011–2012.2 As is typical for ABS surveys, they were based on sophisticated sampling methods and face-to-face interviews conducted by specially trained staff, with response rates of 80%–90%. These surveys are therefore of the highest quality. Alcohol consumption data were collected from respondents aged 18 years or over in the 2001 survey, and from those aged 15 years or older in the 2011–2012 survey. In this article, we compare the data from these two surveys to determine whether alcohol consumption in Australia changed over this period.
Alcohol consumption by adults aged 18 years or over
Respondents were asked when they had last had an alcoholic drink. In both surveys, just over 60% of adults had consumed alcohol during the past week, one in five reported that they had consumed alcohol in the past 12 months, just over 6% reported not having had a drink for more than 12 months, and 9%–10% claimed to have never consumed alcohol.
Sex- and age-related differences
Respondents who reported having had an alcoholic drink during the week before the interview were asked to provide details about the amount, brand and type consumed during the most recent three days. This information was converted by the ABS into numbers of standard drinks (equivalent to 10 g or 12.5 mL pure alcohol).
The weighted average daily alcohol intake increased between the two surveys by 13%, from a mean (± standard error) of 3.9 ± 0.05 in 2001 to 4.3 ± 0.06 standard drinks in 2011–2012. Over the same period, consumption among men increased from 4.7 ± 0.07 to 5.0 ± 0.10 standard drinks, and for women from 2.8 ± 0.06 to 3.4 ± 0.07 standard drinks. While women consumed much less alcohol than men in each survey, the gender gap had narrowed — women had consumed 40% less alcohol than men in 2001, but only 33% less during 2011–2012.
Analysis of the alcohol consumption data by age group identified three important features:
alcohol consumption tended to decline with increasing age;
mean alcohol consumption for each age group had increased between 2001 and 2011–2012;
the increase was statistically significant only for those under 55 years of age (Box 1).
Alcohol consumption by teenagers aged 15–19 years
As noted earlier, information on alcohol consumption among teenagers aged 15–19 years was collected during the 2011–2012 health survey, but not in the 2001 health survey. In this age group, 41.6% ± 2.89% had consumed alcohol during the week before the interview, compared with 60.1% ± 0.61% of those 18 years or older. On the other hand, 21.1% ± 1.67% of those aged 15–19 years but only 9.0% ± 0.36% of those 18 years or older reported having never consumed alcohol.
The average daily consumption over days recorded for those aged 15–19 years was 7.1 ± 0.45 standard drinks. This was 65% higher than the average for adults (4.3 ± 0.06 standard drinks). The gender gap in alcohol consumption for this age group was only 9%, compared with 33% for adults.
The socioeconomic gradient in alcohol consumption
Analysis of the data from both surveys in terms of the education, occupation and labour force status of respondents indicated that tertiary qualifications, employment and white-collar occupations were associated with lower daily levels of alcohol consumption.
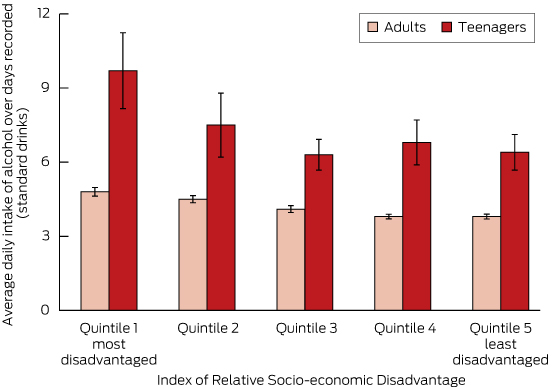
The socioeconomic gradient in alcohol consumption was also observed when data from the 2011–2012 survey were analysed according to the Index of Relative Socio-economic Disadvantage (IRSD) for each respondent’s neighbourhood. The IRSD is one of the multidimensional Socio-Economic Indexes for Areas (SEIFA) calculated by the ABS from 2011 census data on variables such as education, occupation, unemployment and household income.3
Box 2 presents the weighted average daily alcohol intake over days recorded by IRSD quintiles. Quintile 1 includes areas with the highest levels of socioeconomic disadvantage (ie, the most disadvantaged 20%) and quintile 5 the least disadvantaged. The difference in alcohol consumption between the highest and lowest quintiles was in the order of 21% for adults (aged 18 years or older) and 34% for teenagers (15–19 years). Mean alcohol consumption among teenagers was substantially higher than for adults in every quintile.
Household expenditure on alcohol is another aspect of alcohol consumption relevant to health: money spent on alcohol cannot be used to buy food. Using data from the Household Expenditure Survey (HES) of 2003–2004, Yusuf and de Meyrick4 found that the average weekly expenditure on alcohol by households that reported purchasing it was $39.95 ± $0.91, equivalent to 3.8% of total household expenditure on all goods and services. Similar analysis of the 2009–2010 HES data indicated that the average weekly expenditure on alcohol had increased to $56.50 ± $1.50, but as a proportion of total household expenditure it had only increased to 3.9%, which was not a significant change from the previous survey.
Disaggregating the expenditure data from the 2009–2010 HES according to household income quintile showed that households in the lowest quintile spent $31.34 ± $1.58 per week on alcohol, while those in the highest income quintile spent $381.68 ± $4.15. But the poorer households spent a much greater proportion of their total household budget on alcohol than their wealthier counterparts: 4.6% compared with 3.6%.
NHMRC guidelines and risky levels of alcohol consumption
Both health surveys also analysed alcohol consumption data in terms of the 2001 National Health and Medical Research Council (NHMRC) guidelines for minimising the longer-term risk posed by alcohol consumption (low-risk intake for men: up to 4 standard drinks per day, medium risk: 5–6, and high risk: more than 7 standard drinks per day; for women: about half these levels).5
While the sex differences in alcohol consumption we noted earlier persisted, 50.9% ± 0.51% of all respondents aged 18 years or over who reported drinking during the week before the 2001 survey were in the low-risk category, 6.7% ± 0.24% in the medium-risk category and 4.1% ± 0.19% in the high-risk category. The corresponding statistics for the 2011–2012 survey were 48.0% ± 0.55%, 7.1% ± 0.26% and 4.7% ± 0.24%, respectively. These figures indicate a decline between the two surveys in the proportion drinking at the low-risk level, with increases in both the medium- and high-risk categories. A comparison for drinkers younger than 18 years was not possible because of the unavailability of data in the 2001 health survey.
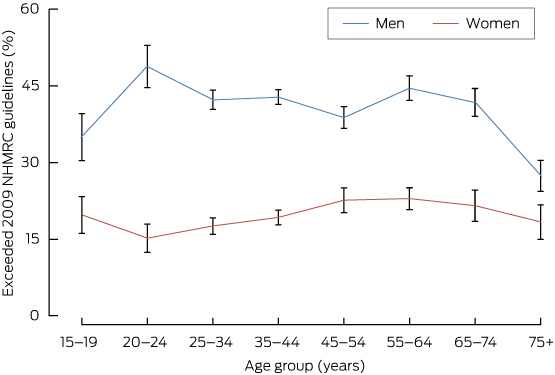
The 2009 NHMRC guidelines for reducing lifetime risk from drinking alcohol6 were used to analyse the 2011–2012 survey. Unlike the 2001 NHMRC guidelines, the 2009 guidelines do not provide separate recommendations for men and women. In order to reduce the lifetime risk of disease or injury, they recommend “drinking no more than two standard drinks on any day” and “no more than four standard drinks on a single occasion”.
The number of standard drinks consumed during the week before the interview (7-day average) was used to identify respondents who exceeded the 2009 NHMRC guidelines. Among those 18 years of age or older, 29.2% ± 0.73% of men and 10.1% ± 0.51% of women had exceeded the 2009 guidelines’ safe level, while the corresponding figures for those aged 15–19 years were 35.0% ± 4.57% (men) and 19.8% ± 3.57% (women). Box 3 depicts the percentages of persons exceeding the 2009 guidelines by age and sex. For every age group, the proportion of men exceeding the guidelines was significantly greater than that of women, consistent with the sex differences in alcohol consumption noted earlier.
Conclusion
Our analysis of the data from two nationally representative surveys suggests that the consumption of alcohol in Australia has increased in recent years. A sex difference in alcohol consumption by adults was evident in both surveys. Based on the 2011–2012 survey, the prevalence of alcohol intake among those aged 15–19 years was significantly higher than in adults. Moreover, relatively disadvantaged people reported higher consumption levels, and they also spent a somewhat larger proportion of their household budget on alcohol.
Our finding of a trend to increased alcohol consumption contrasts with that of an Australian Institute of Health and Welfare (AIHW) survey7 which found a decline in alcohol consumption in recent years. This may be due to methodological differences between the ABS and AIHW surveys. One major difference was the reference period for collecting alcohol consumption data: one week before the interview in ABS surveys, but one year before the interview in the AIHW surveys. Another was the much lower response rate in the AIHW surveys — about half of that for the ABS surveys.
However, our findings regarding the sex differences, age patterns and the socioeconomic gradient in alcohol consumption were similar to those reported by the AIHW. A socioeconomic gradient in levels of alcohol consumption was also noted in a study conducted in the United Kingdom.8
1 Weighted average daily alcohol intake over days recorded (with standard errors) by age
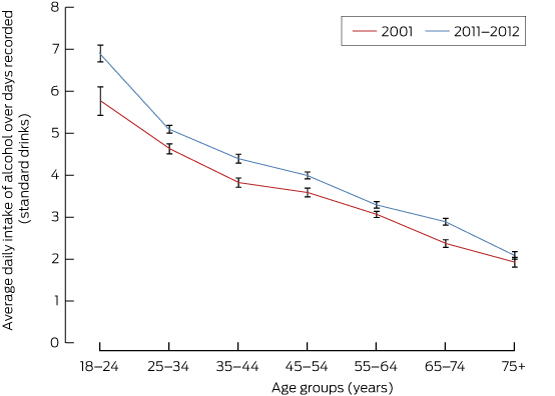
Source: National Health Survey, 2001 and Australian Health Survey, 2011–2012.
Provenance: Not commissioned; externally peer reviewed.
- Farhat Yusuf1
- Stephen R Leeder1
- 1 University of Sydney, Sydney, NSW
- 2 Macquarie University, Sydney, NSW
No relevant disclosures.
- 1. Australian Bureau of Statistics; . National Health Survey: users’ guide, 2001. Canberra: ABS, 2003. (ABS Cat. No. 4363.0.55.001.) http://www.abs.gov.au/AUSSTATS/abs@.nsf/66f306f503e529a5ca25697e0017661f/11b070b0d4af5baeca256d32001b04b4!OpenDocument
- 2. Australian Bureau of Statistics. Australian Health Survey: users’ guide, 2011–13. Canberra: ABS, 2013. (ABS Cat. No. 4363.0.55.001.) http://www.abs.gov.au/AUSSTATS/abs@.nsf/Lookup/4363.0.55.001Main+Features12011-13?OpenDocument
- 3. Australian Bureau of Statistics. Census of population and housing: Socio-Economic Indexes for Areas (SEIFA), Australia, 2011. Canberra: ABS, 2013. (ABS Cat. No. 2033.0.55.001.) http://www.abs.gov.au/ausstats/abs@.nsf/mf/2033.0.55.001
- 4. Yusuf F, de Meyrick J. Alcohol buying behaviour of Australian households. In: Hoque N, Swanson DA, editors. Opportunities and challenges for applied demography in the 21st century. Dordrecht: Springer, 2012: 175-194.
- 5. National Health and Medical Research Council. Australian alcohol guidelines: health risks and benefits. Canberra: NHMRC, 2001. http://www.nhmrc.gov.au/guidelines/publications/ds9 (accessed Nov 2014)
- 6. National Health and Medical Research Council. Australian guidelines to reduce health risks from drinking alcohol. Canberra: NHMRC, 2009. http://www.nhmrc.gov.au/guidelines/publications/ds10 (accessed Nov 2014)
- 7. Australian Institute of Health and Welfare. National Drug Strategy Household Survey detailed report: 2013. Canberra: AIHW, 2014. http://www.aihw.gov.au/publication-detail/?id=60129549469 (accessed Nov 2014)
- 8. Fone D, Farewell D, White J, et al. Socioeconomic patterning of excess alcohol consumption and binge drinking: a cross-sectional study of multilevel associations with neighbourhood deprivation. BMJ Open 2013; 3: e002337.
Michael Kemp
Also, are the 40% of respondents who did not consume alcohol in the last week included in these daily averages? If not, then again these averages are inflated.
Competing Interests: No relevant disclosures
Dr Michael Kemp
Charles Sturt University
Michael Livingston
Between 2001 and 2011, per-capita alcohol consumption figures produced by the ABS declined (from 10.22l/person to 10.04 (2)). Further, these data show an increase from 2001 to 2007, followed by a sharp decline of 8.9% between 2007 and 2013 -- a decline matched closely in data from the National Drug Strategy Household survey (10.5%, unpublished analyses).
By analysing just two waves of the NHS data, the authors miss a significant turning point in consumption trends, led by declines among young drinkers (3). Further analyses using 2004/05 and 2007/08 NHS would provide a clearer picture of consumption trends (e.g. ABS reports on the NHS show a recent decline in risky drinking (4)), but these surveys were not included.
Alcohol consumption is measured idiosyncratically in the NHS using flawed measures involving the last three drinking occasions (within the past week), meaning that estimates are biased by the day of the week that the survey is conducted (5). Further, Yusuf and Leeder appear to report consumption per person who drank in the week before the survey (rather than per capita), making comparisons between teenagers and adult drinkers problematic, given their markedly different drinking frequencies.
Relying solely on NHS data to estimate Australian alcohol consumption trends is problematic; a more complete picture than that presented in Yusuf and Leeder is required.
1. Yusuf, F. & Leeder, S. R. (2015) Making sense of alcohol consumption data in Australia, Medical Journal of Australia, 203, 128-130.
2. Australian Bureau of Statistics (2015) Apparent Consumption of Alcohol, Australia, 2013-14 (Canberra, Australian Bureau of Statistics).
3. Livingston, M. (2014) Trends in non-drinking among Australian adolescents, Addiction, 109, 922-929.
4. Australian Bureau of Statistics (2012) Australian Health Survey: First Results, 2011-12 (Canberra, ABS). http://www.abs.gov.au/ausstats/abs@.nsf/Lookup/D522399EBE2DAB46CA257AA30014BE96?opendocument
5. Donath, S. (1999) Estimated alcohol consumption in the 1995 National Health Survey: Some methodological issues, Australian and New Zealand Journal of Public Health, 23, 131-134.
Competing Interests: No relevant disclosures
Dr Michael Livingston
National Drug and Alcohol Research Centre, University of New South Wales
Farhat Yusuf
The weighted daily averages were based on responses to questions about alcohol consumption (in standard drinks) over the three most recent days when alcohol was consumed during the week prior to the interview (see the titles and Y-axes of Boxes 1 and 2). Persons not reporting alcohol consumption during the past week were not included in the denominators of these weighted averages.
Apart from collecting the consumption data for each day of the week - which ABS did not do –converting a 3-day into a 7-day average by extrapolation will not necessarily provide an accurate estimate of the weekly average. In any case, such a conversion would not have changed our findings regarding the increased alcohol consumption over the 10-year period.
Competing Interests: No relevant disclosures
Prof Farhat Yusuf
The University of Sydney and Macquarie University
Farhat Yusuf
1. “Estimates of 'apparent consumption' are obtained from information related to supply (for example, excise data on alcohol produced for domestic consumption, and data on imports) and do not represent actual consumption.” (See: Media Release section).
2. “This estimation differs from personal consumption estimates from a survey from which individual and group patterns may be derived.” (See: About This Publication section).
Since both NHS were each conducted over two financial years (2001 NHS from February to November 2001 and the 2011-12 NHS from March 2011 to March 2012), the apparent consumption figures corresponding to them were 10.12 and 10.17 litres respectively (derived from data in Table 7 of the second reference). These figures corroborate our finding of an increase in alcohol consumption over the 10-year period rather than the claims made by Livingston and Dietze.
We used only the 2001 and 2011-12 NHS and not the two intervening surveys conducted in 2004-05 and 2007-08 as Livingston (reference 3) did in his paper by ignoring the 2004 and 2007 National Drug Strategy Household surveys.
The criticisms made by Donath (reference 5) of AHS methods referred to the 1995 NHS and do not necessarily apply to the surveys used in our paper. Finally, the consumption measures used in the NHS were quite similar to measures used in surveys in UK, USA and elsewhere.
Competing Interests: No relevant disclosures
Prof Farhat Yusuf
The University of Sydney and Macquarie University