


Tobacco tax increases have been identified as the most effective single intervention to reduce demand for tobacco,1 with higher taxes associated with greater reductions in cigarette sales.2,3 In the 2009 report of the Australian National Preventative Health Taskforce, the first recommendation for reducing tobacco consumption was to make tobacco products significantly more expensive. At the time, Australia was lagging behind international comparators, with a pack of 30 cigarettes costing $13.50 in Sydney, compared with $16 in Toronto (Canada) and $20 in Dublin (Ireland).4 On 30 April 2010, the Federal Government announced a 25% increase in tobacco tax, effective immediately, raising the price of an average pack of 30 cigarettes by around $2.20. This was the first real-terms tobacco tax increase in Australia in a decade.
Most of the research on the link between tobacco tax increases and changes in cigarette consumption has used sales data5 and smoking prevalence data.6-8 Collecting population-based smoking cessation data at the time of a tobacco tax increase is difficult, because taxation policies are usually implemented rapidly. As a result, only a few studies have examined the impact of rising cigarette prices on individual-level measures of smoking cessation. One study compared the proportion of smokers reporting a quit attempt in the months before, and the month immediately after, a 95 cents per pack cigarette price increase in California;7 there was a significant increase in cessation activity in the month after the increase.
Smokers were defined as those who reported that they currently smoked cigarettes, pipes or other tobacco products daily, weekly, or less often than weekly.
Recent quitters were defined as those who reported that they do not currently smoke at all, but have smoked in the past 12 months.
The method used for determining recent quitting activity is described in Box 1.
Demographic characteristics — age, sex, household income, and level of education — were obtained from the survey. Postcodes were used with the Socio-Economic Indexes for Areas9 to indicate socioeconomic status (SES) (dichotomised into low SES = quintiles 4–5; and moderate–high SES = quintiles 1–3).
For smokers, a heaviness of smoking index (HSI) was constructed using a short form of the Fagerström tolerance questionnaire,10 with slight modification. The HSI is calculated as a combination of time to first cigarette after waking and number of cigarettes smoked per day, and was divided into three categories (low, moderate, high).
Owing to a slight overrepresentation of older and women smokers, weights were applied in descriptive analyses to adjust for sex, age and region, according to the NSW population,11 to provide estimates of quitting activity in this population. Unweighted data were used for regression analyses. All analyses were conducted using SPSS version 18.0 (IBM, Armonk, NY, USA).
In 2009, of 67 753 telephone numbers randomly selected for the survey, 41 689 (62%) could be assessed for eligibility (others were non-contactable or non-respondents) and eligible individuals were contacted at 7246 (17%) of these. Of those eligible, 2500 (35%) people consented to participate and completed the survey. Rates of consent were consistent across the months; the final sample size for February to September 2009 was 1604.
From January to September 2010, 47 243 telephone numbers were randomly selected, 28 287 (60%) could be assessed for eligibility and 4564 (16%) eligible individuals were identified. Of these, 1792 (39%) consented and completed the survey. The final sample size for February to September 2010 was 1699. The demographic characteristics and smoking data for the two samples are shown in Box 2.
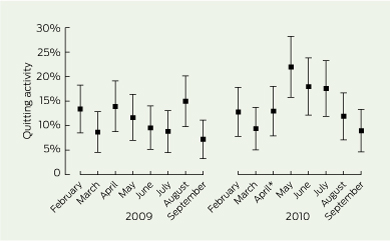
In the month after the tax increase, 22% of current smokers quit or attempted to quit smoking, compared with 13% in the previous month. Box 3 shows the proportions of smokers and recent quitters who reported quitting activity in the months before and after the tax increase in 2010, and in the corresponding months in 2009. After the tax rise, there was an almost 70% increase in the rate of quitting activity from April to May. This increase was sustained at least somewhat throughout June and July before decreasing again in August and September. For comparison, in May 2009, only 12% of current smokers reported any quitting activity.
Multiple logistic regression analyses tested whether respondents interviewed in the months after the tax increase were more likely to report recent quitting activity compared with the months before the tax increase, controlling for individual characteristics (sex, age, socioeconomic status, income and education). The results, shown in Box 4, indicated that respondents interviewed in the 3 months immediately after the tax increase were significantly more likely to report recent quitting activity than those interviewed before the tax increase, but those interviewed 4–6 months after the increase were no more likely to report quitting activity. For comparison, the same multiple logistic regression model was fitted to the 2009 data (Box 4). This analysis showed no significant differences in quitting activity for respondents interviewed in May–July compared with those interviewed in the previous months.
To date, very few studies able to examine associations between a cigarette tax increase and smoking cessation have been conducted using population-based survey data. Our findings indicate that quitting activity increased substantially in the months immediately after the 2010 tax increase, suggesting a direct link between the price increase and smoking cessation. By examining individual-level data, this result extends previous research linking tax increases to decreases in cigarette sales data,2,3 and to smoking prevalence.6 Extrapolating from our data, if 22% of the NSW smoking population quit or attempted to quit in the month of May 2010, this would be more than 200 000 smokers, almost double the number who stopped smoking or tried to quit in April before the tax increase.
Other studies have used surveys of smokers to explore cessation activity stimulated by tax increases. In a survey of Massachusetts smokers after a 25 cents per pack tax increase in the early 1990s, 44% of smokers who quit after the tax rise reported that the price increase had had at least some effect on their quitting, and 35% of continuing smokers reported that the tax increase made them consider quitting.12 However, this survey relied on retrospective recall and was conducted about 9–15 months after the increase. In population surveys conducted after five successive tax increases in Germany, 4%–8% of smokers reported that the tax increases had prompted them to quit, with an increased likelihood of cessation activity associated with a greater price increase.13 Recent evidence from the United States and Canadian International Tobacco Control (ITC) projects has shown that smokers living in areas with higher tobacco prices are more motivated to quit, and have an increased likelihood of actually quitting.14 In the ITC survey in Mexico, the number of smokers reporting serious attempts to quit in the past year increased in the year after a tax rise; however, this study was also conducted many months after the tax increase and relied on retrospective recall.15
Although our study presented a unique opportunity to assess quitting activity in NSW after the tobacco tax increase, it is subject to certain limitations. First, the data are based on retrospective reports of quitting as opposed to a longitudinal follow-up of individuals who quit. Second, the somewhat low response rate of the survey might have led to some bias in the sample composition. However, this response rate is similar to that of other population telephone surveys in Australia16 and the US,17 and recent studies have indicated that differences in response rates have frequently shown only minor effects on key estimates.18 Additionally, the overall rates of quitting in our sample are similar to those of larger population surveys of NSW smokers.19 Finally, our analyses did not account for variations in other policy or program influences on smokers during this period, such as media campaigns or legislation. However, there were no substantial changes to tobacco control policies implemented in NSW in May 2010.
The results of our study show that the 2010 tax increase was associated with an increase in the number of smokers making quit attempts and quitting, but this activity was not sustained in the long term. In 2009, the National Preventative Health Taskforce proposed that smoking prevalence in Australia could be reduced to 9% by introducing, among other things, a 49% increase in the average price per cigarette (from $0.45 to $0.67, or greater than $20 per pack).4 The tax rise in 2010 increased the price by 25%. If the tax was further raised to the rate that the Taskforce recommended, the increase in quit attempts may contribute to a substantial decrease in smoking prevalence. Such tax increases, however, need to be accompanied by appropriate cessation, prevention and education efforts to stimulate interest in quitting and support quit attempts.
1 Determining recent quitting activity
Smokers were asked if they had ever tried to quit smoking and, if they had tried (at least once), when they last tried to quit (in the past 2 weeks; in the past month; in the past 6 months; in the past 12 months; over 12 months ago).
Smokers who had quit in the previous 12 months (recent quitters) were asked how long ago they quit smoking (in the past 2 weeks; in the past month; in the past 6 months; in the past 12 months; over 12 months ago).
For each calendar month, we could then calculate the proportion of smokers who made an attempt to quit (either successful or unsuccessful) from the pool of smokers available to quit (ie, current smokers and recent quitters who quit within the past month).
Quitting activity was ascribed to specific months depending on the timing of the interview — eg, respondents were classified as having quitting activity in May if they were:
interviewed in the first 2 weeks of May and had quit or attempted to quit in the past 2 weeks;
interviewed in the last 2 weeks of May and had quit or attempted to quit in the past month (including the last 2 weeks); or
interviewed in the first 2 weeks of June and had quit or attempted to quit in the past month, but not in the past 2 weeks.
Recent quitters who stopped smoking more than 1 month before their interview were excluded, as they were not available to make a quit attempt during that month.
Smokers who had made a quit attempt in the 6 months before interview, but not in the previous month, were also excluded because their quit attempt could not accurately be ascribed to any particular month, and we had no information on how long they had been abstinent.
Smokers who had made a quit attempt in the past 12 months, but not within the past 6 months, were included as current smokers with no quit attempt, as they were available to make a quit attempt throughout the study period.
3 Percentage of smokers and recent quitters (95% CI) reporting quitting activity in the months before and after the 2010 tobacco tax increase, and in the corresponding months in 2009
4 Results of logistic regression analyses predicting quitting activity before and after the tobacco tax increase in 2010 and in the same period in 2009
Percentage of respondents with recent quitting activity by category |
|||||||||||||||
* Sample sizes vary from the total because of missing values on some variables and respondents being excluded from analyses due to coding of recent quitting activity, as described in Box 1. † For 2010, February–April = pre-tax increase; May–July = immediate post-tax increase; and August–September = delayed post-tax increase. ‡ P < 0.05. § P < 0.01. |
|||||||||||||||
Received 7 February 2026, accepted 7 February 2026
- Sally M Dunlop1
- Trish F Cotter2
- Donna A Perez2
- 1 Sydney School of Public Health, University of Sydney, Sydney, NSW.
- 2 Cancer Prevention Division, Cancer Institute New South Wales, Sydney, NSW.
No relevant disclosures.
- 1. Chaloupka FJ. Macro-social influences: the effects of prices and tobacco-control policies on the demand for tobacco products. Nicotine Tob Res 1999; 1 Suppl 1: S105-S109.
- 2. Gallet CA, List JA. Cigarette demand: a meta-analysis of elasticities. Health Econ 2003; 12: 821-835.
- 3. Farrelly M, Pechacek TF, Chaloupka F. The impact of tobacco control program expenditures on aggregate cigarette sales: 1981-2000. J Health Econ 2003; 22: 843-859.
- 4. Preventative Health Taskforce. Australia: the healthiest country by 2020. Technical Report 2. Tobacco control in Australia: making smoking history. Including addendum for October 2008 to June 2009. Prepared for the Preventative Health Taskforce by the Tobacco Working Group. Canberra: Commonwealth of Australia, 2009 http://www.health.gov.au/internet/preventativehealth/publishing.nsf/Content/tech-tobacco (accessed Jul 2011).
- 5. Glantz SA. Changes in cigarette consumption, prices, and tobacco industry revenues associated with California’s Proposition 99. Tob Control 1993; 2: 311-314.
- 6. Scollo M, Younie S, Wakefield M, et al. Impact of tobacco tax reforms on tobacco prices and tobacco use in Australia. Tob Control 2003; 12 Suppl 2: ii59-ii66.
- 7. Reed MB, Anderson CM, Vaughn J, Burns DM. The effects of cigarette price increases on smoking cessation in California. Prev Sci 2008; 9: 47-54.
- 8. Martire KA, Mattick RP, Doran CM, Hall WD. Cigarette tax and public health: what are the implications of financially stressed smokers for the effects of price increases on smoking prevalence. Addiction 2010; 106: 622-630.
- 9. Australian Bureau of Statistics. Census of population and housing: socio-economic indexes for areas (SEIFA), Australia - data only, 2006. Canberra: ABS, 2008. (ABS Cat. No. 2039.0.) http://www.abs.gov.au/ausstats/abs@.nsf/mf/2033.0.55.001 (accessed Jul 2011).
- 10. Heatherton TF, Kozlowski L, Frecker RC, Fagerström KO. The Fagerström test for nicotine dependence: a revision of the Fagerström tolerance questionnaire. Br J Addict 1991; 86: 1119-1127.
- 11. Australian Bureau of Statistics. Population by age and sex, Australian states and territories, June 2006. Canberra: ABS, 2007. (ABS Cat. No. 3201.0.) http://www.abs.gov.au/Ausstats/abs@.nsf/mf/3201.0 (accessed Jul 2011).
- 12. Biener L, Aseltine RH Jr, Cohen B, Anderka M. Reactions of adult and teenaged smokers to the Massachusetts tobacco tax. Am J Public Health 1998; 88: 1389-1391.
- 13. Hanewinkel R, Isensee B. Five in a row - reactions of smokers to tobacco tax increases: population-based cross-sectional studies in Germany 2001-2006. Tob Control 2007; 16: 34-37.
- 14. Ross H, Blecher E, Yan L, Hyland A. Do cigarette prices motivate smokers to quit? New evidence from the ITC survey. Addiction 2010; 106: 609-619.
- 15. Saenz-de-Miera B, Thrasher JF, Chaloupka F, et al. Self-reported price of cigarettes, consumption and compensatory behaviours in a cohort of Mexican smokers before and after a cigarette tax increase. Tob Control 2010; 19: 481-487.
- 16. Thompson ME, Fong GT, Hammond D, et al. Methods of the International Tobacco Control (ITC) Four Country Survey. Tob Control 2006; 15 Suppl 3: iii12-iii18.
- 17. Cantor D, Coa K, Crystal-Mansour S, et al. National Cancer Institute. Health information national trends survey (HINTS) 2007. Final report. February 2009. http://hints.cancer.gov/docs/HINTS2007FinalReport.pdf (accessed Jul 2011).
- 18. Keeter S, Miller C, Kohut A, et al. Consequences of reducing nonresponse in a national telephone survey. Public Opin Q 2000; 64: 125-148.
- 19. Cancer Institute NSW. New South Wales Smoking and Health Survey 2009. Sydney: Cancer Institute NSW, 2009. http://www.cancer institute.org.au/publications/i/new-south-wales-smoking-and-health-survey-2009 (accessed Jul 2011).
Abstract
Objective: To use population-level data to monitor the impact on smoking cessation activity of the April 2010 Australian tobacco tax increase.
Design and setting: The Cancer Institute NSW [New South Wales] Tobacco Tracking Survey (CITTS) is a continuous tracking telephone survey conducting about 50 interviews per week. Data from February to September in 2009 and 2010 were analysed (ie, data on people who quit smoking in the 3 months before and 5 months after the tax increase in 2010 were compared, and quitting activity over the same period in 2009 was also analysed).
Participants: Adult smokers and smokers who had stopped smoking in the previous 12 months; 2009 (n = 1604); 2010 (n = 1699).
Main outcome measure: Recent quitting (defined as stopping smoking or trying to quit within a 1-month period).
Results: 22% of the sample reported that they had quit smoking in May 2010, compared with 13% in April 2010 and 12% in May 2009. Respondents interviewed in the 3 months after the tax increase (May–July) were significantly more likely to report quitting than those interviewed in the 3 months before the tax increase (odds ratio, 1.84; 95% CI, 1.26–2.69; P < 0.01). This increase in quitting activity was not sustained in the subsequent months (August–September).
Conclusions: The tobacco tax increase was associated with a short-term increase in the rate of smoking cessation among NSW adult smokers and recent quitters, suggesting that regular increases in tobacco tax may further encourage quitting activity.