


The known: The Delta variant of SARS‐CoV‐2 that emerged internationally in mid‐2021 was associated with higher mortality and greater demand for health care services than previous variants.
The new: The adjusted risk of dying in hospital was higher for people admitted to intensive care in Australia during the third COVID‐19 wave (second half of 2021) than during earlier waves, despite their lower median age and larger proportion without other medical conditions, and similar median severity of illness scores on admission.
The implications: Higher in‐hospital mortality during the third pandemic wave may have reflected the greater virulence of the Delta variant or the increased volume of COVID‐19‐related intensive care admissions.
The severe acute respiratory syndrome coronavirus 2 (SARS-CoV-2) has continuously evolved since its detection in 2019, with multiple discrete waves of infection and the emergence of new variants. At the same time, clinical practice has rapidly advanced with growing experience and the publication of several key trials.1,2,3 The impact of these changes on patients admitted to intensive care units (ICUs) in Australia has not been examined in detail.
National quarantine and social distancing measures constrained the number of SARS‐CoV‐2 infections during the first and second coronavirus disease 2019 (COVID‐19) waves in Australia,4,5 and hospital and ICU loads remained at near normal levels.6,7 However, the emergence of the Delta strain in mid‐2021 reduced the effectiveness of these measures, leading to increased community transmission.8 The aim of our study was to compare the demographic features, clinical presentation, management, and outcomes for patients admitted with COVID‐19 to ICUs during the first, second, and third waves of the pandemic in Australia.
Methods
We undertook a prospective, multicentre observational study of people aged 16 years or more admitted with polymerase chain reaction (PCR)‐confirmed COVID‐19 to the 78 Australian ICUs participating in the Short Period Incidence Study of Severe Acute Respiratory Infection (SPRINT‐SARI) Australia project.6 Data were collected using the case report form we have previously described6,7 and entered into a web‐based REDCap data management system, securely stored, and used for preparing regular reports. If a patient was transferred from one ICU to another ICU, the intensive care episodes were treated as a single ICU admission and the corresponding data combined.
Definitions
ICU admissions were assigned to the first (27 February – 30 June 2020), second (1 July 2020 – 25 June 2021), or third COVID‐19 waves (26 June – 1 November 2021). The primary outcome of our study was in‐hospital mortality. Secondary outcomes were ICU mortality, ICU and hospital lengths of stay, and the use of supportive and disease‐specific therapies. We also collected information on patient and treatment characteristics, and on complications. Bed occupancy was defined as the proportion of beds in an ICU, as reported by the Critical Health Resources Information System (CHRIS), occupied by patients with COVID‐19.9 We extracted data for all patients admitted to 1 November 2021; outcomes data were censored at 8 December 2021. We report proportions based on the number of patients for whom data were available.
Statistical analysis
We summarise data by COVID‐19 wave as descriptive statistics: continuous variables as medians (with interquartile ranges, IQRs) and categorical variables as proportions (with 95% confidence intervals, CIs). The statistical significance of differences between waves was assessed in Kruskal–Wallis (continuous variables) or Fisher exact tests (categorical variables).
Time to ICU and hospital discharge is depicted in transition plots of outcomes; subdistribution hazard ratios for length of stay were estimated in a Fine–Gray competing risk model.10 ICU and in‐hospital mortality were compared in mixed effect, generalised linear models (binomial distribution), with ICU as first level and week of admission as the second level; we report risk differences (RDs) with 95% CIs.11 Duration of ventilation was compared in a quantile model (τ = 0.50), using an interior point algorithm;12 we report median differences with 95% CIs calculated after bootstrapping with 1000 samples.
The coviariates included in adjusted analyses were age, body mass index, acute physiology and chronic health evaluation (APACHE) II score, number of co‐existing disorders, mean time from hospital to ICU admission, number of patients admitted to ICU per month, use of mechanical ventilation, and time between consecutive ICU admissions; hospital and week of admission were included as random effects. In sensitivity analyses, the models were recalculated using worst case, best case, and multiple imputation handling of missing outcomes data.
Change in mortality risk over time by severity of illness (ventilated, non‐ventilated) was assessed in exponentially weighted moving average (EWMA) plots. The EWMA takes the entire history of a given output into account rather than treating each data point separately; each output (previous sample mean) is weighted, with the most recent samples receiving the greatest weight. The EWMA approach is sensitive to smaller and moderate shifts in the process assessed (here: in‐hospital mortality).13 We applied a weight of 0.005, with boundaries of predicted risk of three standard deviations. The predicted risk of death was derived from the admission APACHE II score, with admission attributed to respiratory infection. In the EWMA plot, we compared in‐hospital mortality to APACHE II‐predicted mortality to monitor changes over time. All analyses were conducted in R 4.0.3 (R Foundation for Statistical Computing).
Ethics approval
The Human Research Ethics Committee of Alfred Health approved data collection and their analysis for this report, and waived the requirement for informed consent by individual patients (HREC/16/Alfred/59).
Results
During 27 February 2020 – 1 November 2021, 2534 patients with PCR‐confirmed SARS‐CoV‐2 infections were admitted to 59 of the 78 ICUs participating in SPRINT‐SARI Australia. After excluding 36 patients under 16 years of age, data for 2493 patients were included in our analysis: 214 from the first (9%), 296 from the second (12%), and 1983 from the third COVID‐19 wave (80%) (Supporting Information, table 1). The proportion of available ICU beds (as reported by CHRIS) occupied by patients with COVID‐19 was 2.8% (95% CI, 2.7–2.9%) during the first wave, 4.6% (95% CI, 4.3–5.1%) during the second wave, and 19.1% (95% CI, 17.9–20.2%) during the third wave (Box 1). Bed occupancy patterns differed between states and hospitals (Supporting Information, figure 1).
Characteristics of patients and admission processes
The proportions of people admitted to intensive care during the third wave who were pregnant (9% of women; waves 1 and 2, < 1%), or who did not have other medical conditions (41%; waves 1 and 2, 30%) were larger than during the first two waves, their median age was lower (proportion over 65 years: wave 3, 24%; waves 1 and 2, 37%), and the health care worker proportion was smaller (1%; waves 1 and 2, 9%); median APACHE II illness severity scores were similar for the three waves. Of 1692 patients admitted during the third wave for whom vaccination information was available (85%), 1264 were not vaccinated (75%), 344 had received one dose (20%), and 84 had received two COVID‐19 vaccine doses (5%) (Box 2).
Median time from symptom onset to ICU admission was similar during the three waves, but median time from hospital admission to ICU admission was longest during the third wave (first wave, 10.6 [95% CI, 2.6–59.0] hours; second wave, 7.8 [95% CI, 2.5–34.9] hours; third wave, 15.8 [95% CI, 4.8–59.2] hours) (Box 3).
Interventions and complications
The proportion of patients treated with tocilizumab (12% v < 1%) was larger during the third wave than during the first two waves; the proportion treated with steroids was larger during the second and third waves than during the first wave (95% v 30%). The proportion treated with antibiotics was smaller during the third wave than during the first two waves (76% v 90%), and that of patients treated with remdesivir was smaller during the third than the second wave (12% v 51%). The proportions who needed invasive ventilation were similar during the second and third waves (49% v 50%); the proportions who received high flow nasal cannulas (79% v 69%), non‐invasive ventilation (42% v 15%), or prone positioning (63% v 35%) were larger during the third than the second wave. The proportions of patients treated with vasopressor or inotropic agents or with neuromuscular blockers both declined across the three waves (Box 4).
The incidence of arrhythmia (8% v 14%) and myocarditis (2% v 10%) were each lower during the third wave than during the first two waves, and that of deep vein thrombosis was lower during the second and third waves than during the first (4% v 9%); the incidence of bacterial pneumonia (35% v 20%) and pulmonary embolism (9% v 4%) were each higher during the third wave than during the first two waves (Box 4).
Clinical outcomes
Information on hospital outcomes was available for 2175 patients (86%) and on intensive care outcomes for 2303 patients (92%). The median duration of mechanical ventilation (10.0 [IQR, 6.0–18.0] days v 12.0 [IQR, 7.8–15.0] days) and ICU (5.9 [IQR, 2.7–12.3] days v 8.1 [IQR, 3.1–18.7] days) and hospital lengths of stay (13.2 [IQR, 8.3–22.2] days v 17.2 [IQR, 9.0–31.2] days) were shorter during the third wave than during the first wave (Box 5).
Crude in‐hospital and ICU mortality was similar during the three waves, except that in‐hospital mortality was greater during the third than during the second wave (281 of 1667 [17%] v 35 of 295 patients died [12%]; RD, 5.0 [95% CI, 0.62–8.8] percentage points) (Box 5; Supporting Information, figure 2). In adjusted analyses, risk of in‐hospital death was greater during the third than the first wave (RD, 9.60 [95% CI, 3.52–16.7] percentage points) (Box 6). Sensitivity analyses using different imputation strategies for missing data yielded similar results (Supporting Information, table 8), as did the transition plot of the status of patients up to 30 days after initial admission (Box 7). EWMA plots indicated that the period of higher mortality during the third wave was correlated with the peak in ICU admission numbers, and was chiefly linked with patients who received mechanical ventilation (Box 8).
Discussion
Adjusted in‐hospital mortality among people admitted to intensive care with COVID‐19 was significantly higher during the third pandemic wave than during the first wave in Australia, particularly among patients who received mechanical ventilation. The peak in mortality risk corresponded to the peak in the number of ICU admissions. During the third wave, the median age of patients admitted to ICUs with COVID‐19 was lower, and larger proportions had no comorbid conditions or were pregnant than during the first two waves. During the third wave, a larger proportion of ICU beds were occupied by patients with COVID‐19 than in earlier waves, and non‐invasive respiratory support, awake and invasive prone positioning, and disease‐specific pharmacological therapies (eg, corticosteroids, interleukin‐6 antagonists) were used more frequently. ICU and hospital lengths of stay were each shortest during the third wave.
Our finding that adjusted in‐hospital mortality among patients with COVID‐19 admitted to ICUs was higher during the third wave than earlier in the pandemic in Australia7 may have several explanations: changes in the epidemiology of the pandemic, differences between states in non‐pharmaceutical interventions, and incomplete population vaccination that left some groups at greater risk of infection and severe disease. The SARS‐CoV‐2 Delta variant was more virulent than earlier strains14,15,16,17 and therefore more likely to cause disease requiring intensive care. It was also more transmissible and more likely to cause serious disease in younger people than previous strains, which had been greater threats for people over 60 years of age.15,18,19,20,21,22,23,24 We found that the median age of patients declined across the three waves, as did the proportion with other medical conditions, although median APACHE II scores on ICU admission were similar.
Pregnancy and obesity have been associated with increased risk of death from COVID‐19.18,25 We found that the prevalence of other risk factors for death, such as chronic cardiac failure and immunosuppression, was lower among intensive care patients with COVID‐19 during the third than during the first two waves. Despite evidence for the benefits of non‐invasive ventilation and awake and invasive prone positioning for patients with other disorders, these interventions may have had unexpected consequences for patients with COVID‐19, including delayed intubation. Some complications were more frequent during the third wave, such as bacterial pneumonia and pulmonary embolism, while others were less frequent, including bacteraemia, deep vein thrombosis, myocarditis, and cardiac arrhythmias.
The proportion of ICU beds occupied by people with COVID‐19 was larger during the third wave (19.1%) than during the second (4.6%) or first waves (2.8%). The greater number of patients, together with unmeasured factors (eg, re‐deployment of non‐ICU staff, ICU staff fatigue, limited ICU resources), may have reduced the capacity to provide usual health care.26 Importantly, we found that differences in mortality between waves were different for ventilated and non‐ventilated patients. The EWMA chart indicated that higher mortality during the third wave was chiefly among patients receiving mechanical ventilation, and was correlated with peak admission numbers. Health care systems overwhelmed by the number of people with COVID‐19, as in Italy and New York during the early phase of the pandemic, experienced inadequate resourcing and delays in admission to intensive care that were associated with higher mortality rates.27,28
Limitations
Changes in ICU admission criteria may have led to selection bias, but median admission APACHE II scores were similar for all three waves. Data on bed occupancy were based on bed numbers prior to the re‐organisation of hospital facilities to meet the rise in demand. The SARS‐CoV‐2 Delta variant was predominant during the third COVID‐19 wave, but we did not have access to individual genotype information for patients. Further, as data on ICU resources, staff numbers, and non‐COVID‐19 ICU demand were not collected, we could not assess the overall hospital burden during each period, nor was information on other possibly relevant factors; for example, referral hospitals with the highest admission rates may also have been receiving the patients with the greatest clinical needs. Data from the first wave were derived from all states and territories, but from the second and third waves were almost exclusively from Victoria and New South Wales, reflecting the epidemiology of these two waves. Institutional characteristics not included in our analyses may have caused unmeasured confounding. Outcomes data were not available for all patients, but the results of sensitivity analyses using different imputation strategies were similar to those of our main analysis. Finally, as we did not adjust our analyses for multiple comparisons, all findings should be considered exploratory.
Conclusion
During the third COVID‐19 wave in Australia, the median age of patients admitted to intensive care was lower than during the first two waves, a larger proportion did not have other medical conditions, and the number who received less invasive therapies, including disease‐specific pharmacological treatments, was higher. Nevertheless, adjusted in‐hospital mortality was highest during the third wave; possible reasons include the greater virulence of the Delta SARS‐CoV‐2 variant, changes in public health measures, and the increased volume of COVID‐19‐related intensive care admissions, which may have hampered usual processes of care. Taken together, our findings reinforce the need to provide adequate resources and support for ICUs, particularly during times of unusually high demand.
Box 1 – Admissions of patients with COVID‐19 to SPRINT‐SARI intensive care units, 9 March 2020 – 30 October 2021*
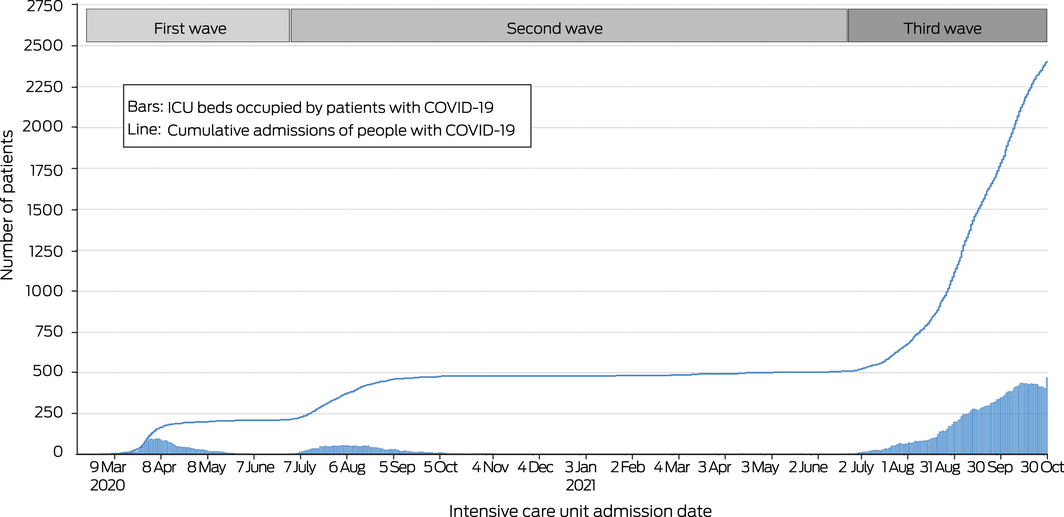
COVID‐19 = coronavirus disease 2019; SPRINT‐SARI = Short Period Incidence Study of Severe Acute Respiratory Infection participants.
* The daily numbers of occupied ICU beds and of cumulative admissions refer to participating ICUs only (ie, not all ICUs in Australia).
Box 2 – Characteristics of patients admitted to SPRINT‐SARI intensive care units with COVID‐19, 27 February 2020 – 1 November 2021*
|
|
First wave |
Second wave |
Third wave |
||||||||||||
|
|
|||||||||||||||
|
Patients |
214 |
296 |
1983 |
||||||||||||
|
Age (years), median (IQR) |
64 (54–72) |
58 (49–68) |
54 (41–65) |
||||||||||||
|
Over 65 years |
100 (47%) |
91 (31%) |
473 (24%) |
||||||||||||
|
Sex (men) |
148 (69%) |
184 (62%) |
1203/1982 (61%) |
||||||||||||
|
Body mass index (kg/m2), median (IQR) |
28.8 (24.6–32.2) |
30.5 (26.6–35.4) |
31.3 (26.7–37.6) |
||||||||||||
|
Health care workers† |
16/203 (8%) |
28/276 (10%) |
11/784 (1%) |
||||||||||||
|
Pregnant (women) |
0/51 |
1/92 (1%) |
61/690 (9%) |
||||||||||||
|
APACHE II score, median (IQR)‡ |
14 (10–18) |
13 (9–17) |
13 (9–16) |
||||||||||||
|
Without age component |
10 (6–14) |
10 (7–14) |
10 (7–14) |
||||||||||||
|
COVID‐19 vaccination |
0 |
1/289 (0.3%) |
428/1692 (25%) |
||||||||||||
|
One dose |
NA |
1 |
344/1692 (20%) |
||||||||||||
|
Two doses |
NA |
0 |
84/1692 (5%) |
||||||||||||
|
COVID‐19 vaccine |
|
|
|
||||||||||||
|
Pfizer/BioNTech |
NA |
0 |
204/417 (49%) |
||||||||||||
|
Oxford/AstraZeneca |
NA |
1 |
200/417 (48%) |
||||||||||||
|
Moderna |
NA |
0 |
8/417 (2%) |
||||||||||||
|
Other |
NA |
0 |
5/417 (1%) |
||||||||||||
|
Time since most recent vaccine dose |
|
|
|
||||||||||||
|
Less than 7 days |
NA |
NR |
55/289 (19%) |
||||||||||||
|
7–14 days |
NA |
NR |
84/289 (29%) |
||||||||||||
|
More than 14 days |
NA |
NR |
150/289 (52%) |
||||||||||||
|
Co‐existing disorders (Charlson index), median number (IQR) |
1 (0–3) |
1 (0–2) |
1 (0–2) |
||||||||||||
|
0 |
68 (32%) |
87 (29%) |
806 (41%) |
||||||||||||
|
1 |
43 (20%) |
88 (30%) |
514 (26%) |
||||||||||||
|
2 |
49 (23%) |
62 (21%) |
339 (17%) |
||||||||||||
|
3 or more |
54 (25%) |
59 (20%) |
324 (16%) |
||||||||||||
|
Medical conditions and factors |
|
|
|
||||||||||||
|
Obesity |
53/210 (25%) |
79/272 (29%) |
547/1598 (34%) |
||||||||||||
|
Diabetes |
60/214 (28%) |
95/280 (34%) |
476/1638 (29%) |
||||||||||||
|
ACEi inhibitor/ARB used |
55/204 (27%) |
47/274 (17%) |
307/1624 (19%) |
||||||||||||
|
Smoker |
27/206 (13%) |
34/268 (13%) |
280/1587 (18%) |
||||||||||||
|
Chronic cardiac failure |
42/209 (20%) |
31/277 (11%) |
185/1633 (11%) |
||||||||||||
|
Asthma |
22/209 (11%) |
43/275 (16%) |
174/1634 (11%) |
||||||||||||
|
Chronic pulmonary disease |
19/210 (9%) |
21/275 (8%) |
92/1635 (6%) |
||||||||||||
|
Chronic kidney disease |
12/210 (6%) |
19/277 (7%) |
82/1633 (5%) |
||||||||||||
|
Immunosuppression |
15/209 (7%) |
21/277 (8%) |
62/1620 (4%) |
||||||||||||
|
Chronic haematological disease |
10/209 (5%) |
5/277 (2%) |
27/1637 (2%) |
||||||||||||
|
Cancer |
4/209 (2%) |
13/277 (5%) |
25/1636 (2%) |
||||||||||||
|
|
|||||||||||||||
|
APACHE II = Acute Physiology and Chronic Health Evaluation II; ACEi = angiotensin‐converting enzyme inhibitor; ARB = angiotensin II receptor blocker; COVID‐19 = coronavirus disease 2019; ICU = intensive care unit; IQR = interquartile range; NA = not applicable; NR = not reported; SPRINT‐SARI = Short Period Incidence Study of Severe Acute Respiratory Infection participants. * Denominators are provided when data are not available for all patients in category. Risk and median differences between pandemic waves are reported in the Supporting Information, table 2. † Nurse, doctor, allied health practitioner, other health care worker, aged care worker, microbiology laboratory employee, disability care worker, childcare worker, police officer. ‡ Assessed within 24 hours of admission to intensive care. |
|||||||||||||||
Box 3 – Patients admitted to SPRINT‐SARI intensive care units with COVID‐19, 27 February 2020 – 1 November 2021: admission characteristics
|
|
First wave |
Second wave |
Third wave |
||||||||||||
|
|
|||||||||||||||
|
Characteristics on hospital admission, median (IQR) |
|
|
|
||||||||||||
|
Heart rate (beats/min) |
95 (84–110) |
102 (91–114) |
100 (89–113) |
||||||||||||
|
Respiratory rate (breaths/min) |
28 (22–35) |
32 (26–38) |
32 (26–40) |
||||||||||||
|
Mean arterial pressure (mmHg) |
82 (72–96) |
78 (69–93) |
79 (71–88) |
||||||||||||
|
Temperature (°C) |
38.4 (37.7–39.0) |
37.9 (37.2–38.7) |
38.2 (37.2–38.9) |
||||||||||||
|
Peripheral oxygen saturation (SpO2) (%) |
92 (89–95) |
92 (87–94) |
91 (87–94) |
||||||||||||
|
Time between events, median (IQR) |
|
|
|
||||||||||||
|
Symptom onset to hospital admission (days) |
6.0 (3.3–8.9) |
6.6 (3.9–9.3) |
6.5 (4.2–8.5) |
||||||||||||
|
Symptom onset to ICU admission (days) |
8.2 (5.0–11.2) |
7.6 (5.3–10.4) |
8.2 (5.9–10.5) |
||||||||||||
|
Hospital admission to ICU admission (hours) |
10.6 (2.6–59.0) |
7.8 (2.5–34.9) |
15.8 (4.8–59.2) |
||||||||||||
|
Between consecutive admissions (same ICU) (hours) |
66.0 (21.1–134) |
79.2 (31.9–251) |
14.2 (5.8–32.5) |
||||||||||||
|
ICU admission to intubation (days) |
1.0 (0.0–1.0) |
1.0 (0.0–1.0) |
1.0 (0.0–2.0) |
||||||||||||
|
|
|||||||||||||||
|
COVID‐19 = coronavirus disease 2019; ICU = intensive care unit; IQR = interquartile range; SPRINT‐SARI = Short Period Incidence Study of Severe Acute Respiratory Infection participants. Median differences between pandemic waves are reported in the Supporting Information, table 2. |
|||||||||||||||
Box 4 – Interventions and complications for patients admitted to SPRINT‐SARI intensive care units with COVID‐19, 27 February 2020 – 1 November 2021*
|
|
First wave |
Second wave |
Third wave |
||||||||||||
|
|
|||||||||||||||
|
Patients |
214 |
296 |
1983 |
||||||||||||
|
Pharmacological therapy |
|
|
|
||||||||||||
|
Antibiotics |
183/201 (91%) |
243/274 (89%) |
341/450 (76%) |
||||||||||||
|
Steroids |
60/201 (30%) |
260/280 (93%) |
1418/1482 (96%) |
||||||||||||
|
Hydroxychloroquine |
35/200 (18%) |
2/274 (1%) |
3/448 (1%) |
||||||||||||
|
Remdesivir |
2 (1%) |
152 (51%) |
240 (12%) |
||||||||||||
|
Tocilizumab |
0 |
3 (1%) |
234 (12%) |
||||||||||||
|
Baricitinib |
0 |
1 |
733/1133 (65%) |
||||||||||||
|
Neutralising antibodies |
0 |
0 |
12/248 (5%) |
||||||||||||
|
Organ support |
|
|
|
||||||||||||
|
Invasive ventilation |
124 (58%) |
140/285 (49%) |
781/1576 (50%) |
||||||||||||
|
High‐flow nasal cannula |
87/203 (43%) |
192/277 (69%) |
1209/1535 (79%) |
||||||||||||
|
Non‐invasive ventilation |
15/204 (7%) |
41/273 (15%) |
643/1534 (42%) |
||||||||||||
|
Prone positioning |
57/203 (28%) |
97/274 (35%) |
967/1533 (63%) |
||||||||||||
|
Prone positioning (without invasive ventilation) |
12 (6%) |
59/281 (21%) |
657/1575 (42%) |
||||||||||||
|
Prone positioning (with invasive ventilation) |
51/212 (24%) |
52/281 (19%) |
452/1556 (29%) |
||||||||||||
|
Extracorporeal membrane oxygenation |
3/213 (1%) |
12/287 (4%) |
80/1637 (5%) |
||||||||||||
|
Renal replacement therapy |
25/203 (12%) |
21/274 (8%) |
106/1513 (7%) |
||||||||||||
|
Tracheostomy |
14/213 (7%) |
24/286 (8%) |
114/1630 (7%) |
||||||||||||
|
Inotropic or vasopressor agent |
117/203 (58%) |
122/273 (45%) |
691/1517 (46%) |
||||||||||||
|
Neuromuscular blocking agent |
90/203 (44%) |
90/272 (33%) |
187/640 (29%) |
||||||||||||
|
Highest level of respiratory support |
|
|
|
||||||||||||
|
None |
63/213 (30%) |
46/283 (16%) |
129/1500 (9%) |
||||||||||||
|
Non‐invasive ventilation or high‐flow nasal cannula |
27/213 (13%) |
98/283 (35%) |
645/1500 (43%) |
||||||||||||
|
Invasive ventilation |
120/213 (56%) |
127/283 (45%) |
646/1500 (43%) |
||||||||||||
|
Extracorporeal membrane oxygenation |
3/213 (1%) |
12/283 (4%) |
80/1500 (5%) |
||||||||||||
|
Complications |
|
|
|
||||||||||||
|
Bacterial pneumonia |
45/196 (23%) |
44/256 (17%) |
508/1440 (35%) |
||||||||||||
|
Bacteraemia |
29/196 (15%) |
24/268 (9%) |
121/1434 (8%) |
||||||||||||
|
Barotrauma† |
12/199 (6%) |
10/268 (4%) |
81/1441 (6%) |
||||||||||||
|
Stroke |
3/198 (2%) |
2/270 (1%) |
19/1442 (1%) |
||||||||||||
|
Arrhythmia |
36/199 (18%) |
32/270 (12%) |
109/1440 (8%) |
||||||||||||
|
Cardiac arrest |
4/198 (2%) |
4/269 (2%) |
29/1437 (2%) |
||||||||||||
|
Pulmonary embolism |
7/182 (4%) |
13/267 (5%) |
122/1442 (9%) |
||||||||||||
|
Deep vein thrombosis |
16/182 (9%) |
11/269 (4%) |
51/1433 (4%) |
||||||||||||
|
Myocarditis |
23/183 (13%) |
20/268 (8%) |
31/1432 (2%) |
||||||||||||
|
|
|||||||||||||||
|
COVID‐19 = coronavirus disease 2019; SPRINT‐SARI = Short Period Incidence Study of Severe Acute Respiratory Infection participants. * Denominators are provided when data are not available for all patients in category. † Patients with pneumothorax, pneumomediastinum, or subcutaneous emphysema (chest X‐ray or computed tomography). Risk differences between pandemic waves are reported in the Supporting Information, tables 3 and 4. |
|||||||||||||||
Box 5 – Clinical outcomes for patients admitted to SPRINT‐SARI intensive care units with COVID‐19, 27 February 2020 – 1 November 2021
|
Outcome |
First wave |
Second wave |
Third wave |
||||||||||||
|
|
|||||||||||||||
|
All patients |
214 |
296 |
1983 |
||||||||||||
|
Intensive care unit outcomes |
|
|
|
||||||||||||
|
Outcomes data available |
213 |
296 |
1794 |
||||||||||||
|
Ventilation (days), median (IQR) |
12.0 (7.8–15.0) |
8.0 (4.0–17.0) |
10.0 (6.0–18.0) |
||||||||||||
|
Length of stay (days) median (IQR) |
8.1 (3.1–18.7) |
5.7 (2.2–11.1) |
5.9 (2.7–12.3) |
||||||||||||
|
Discharged alive |
8.1 (3.1–19.3) |
4.7 (2.1–10.0) |
5.2 (2.5–10.2) |
||||||||||||
|
Died |
7.8 (4.2–12.5) |
16.4 (7.8–23.8) |
14.0 (6.3–21.8) |
||||||||||||
|
Deaths |
30 (14%) |
30 (10%) |
247 (14%) |
||||||||||||
|
Hospital outcomes * |
|
|
|
||||||||||||
|
Outcomes data available |
213 |
295 |
1667 |
||||||||||||
|
Length of stay (days) median (IQR) |
17.2 (9.0–31.2) |
14.0 (8.6–22.0) |
13.2 (8.3–22.2) |
||||||||||||
|
Discharged alive |
18.9 (9.4–34.2) |
13.2 (8.2–20.4) |
12.9 (8.4–21.3) |
||||||||||||
|
Died |
11.5 (6.3–13.4) |
16.7 (9.9–25.3) |
17.0 (8.1–24.9) |
||||||||||||
|
Deaths |
30 (14%) |
35 (12%) |
281 (17%) |
||||||||||||
|
|
|||||||||||||||
|
COVID‐19 = coronavirus disease 2019; IQR = interquartile range; SPRINT‐SARI = Short Period Incidence Study of Severe Acute Respiratory Infection participants. * Includes intensive care unit stay. Risk and median differences between pandemic waves are reported in the Supporting Information, tables 5 and 6. |
|||||||||||||||
Box 6 – Clinical outcomes for patients admitted to SPRINT‐SARI intensive care units with COVID‐19, 27 February 2020 – 1 November 2021: adjusted and unadjusted analyses*
|
|
Length of stay: subdistribution hazard ratio (95% CI) |
Mortality: risk difference (95% CI) |
|||||||||||||
|
Analysis |
Intensive care unit |
Hospital |
Intensive care unit |
Hospital |
|||||||||||
|
|
|||||||||||||||
|
Unadjusted analysis |
|
|
|
|
|||||||||||
|
First wave |
1 |
1 |
Reference |
Reference |
|||||||||||
|
Second wave |
1.40 (1.17–1.66) |
1.27 (1.07–1.51) |
–3.94 (–9.94 to 1.73) |
–2.22 (–8.35 to 3.64) |
|||||||||||
|
Third wave |
1.22 (1.06–1.40) |
1.16 (1.01–1.33) |
–0.31 (–5.63 to 4.24) |
2.77 (–2.60 to 7.41) |
|||||||||||
|
Adjusted analysis† |
|
|
|
|
|||||||||||
|
First wave |
1 |
1 |
Reference |
Reference |
|||||||||||
|
Second wave |
1.29 (0.92–1.82) |
1.03 (0.81–1.31) |
5.29 (–1.66 to 12.2) |
6.67 (–0.20 to 14.1) |
|||||||||||
|
Third wave |
0.80 (0.55–1.15) |
0.67 (0.52–0.85) |
7.55 (1.14 to 13.9) |
9.60 (3.52 to 16.7) |
|||||||||||
|
|
|||||||||||||||
|
CI = confidence interval; COVID‐19 = coronavirus disease 2019; SPRINT‐SARI = Short Period Incidence Study of Severe Acute Respiratory Infection participants. * Length of stay: Fine–Gray competing risk model; mortality: mixed effect, generalised linear model (binomial distribution). † Adjusted for age, body mass index, admission APACHE II score, number of co‐existing disorders, time from hospital to ICU admission, use of mechanical ventilation, number of patients admitted to ICU per month, time between consecutive ICU admission; hospitals and week of admission were included as random effects. The full multivariable model is reported in the Supporting Information, table 7. |
|||||||||||||||
Box 7 – Status of patients admitted to SPRINT‐SARI intensive care units (ICUs) with COVID‐19, 27 February 2020 – 1 November 2021, during 30 days after initial admission: transition plots, by COVID‐19 wave*
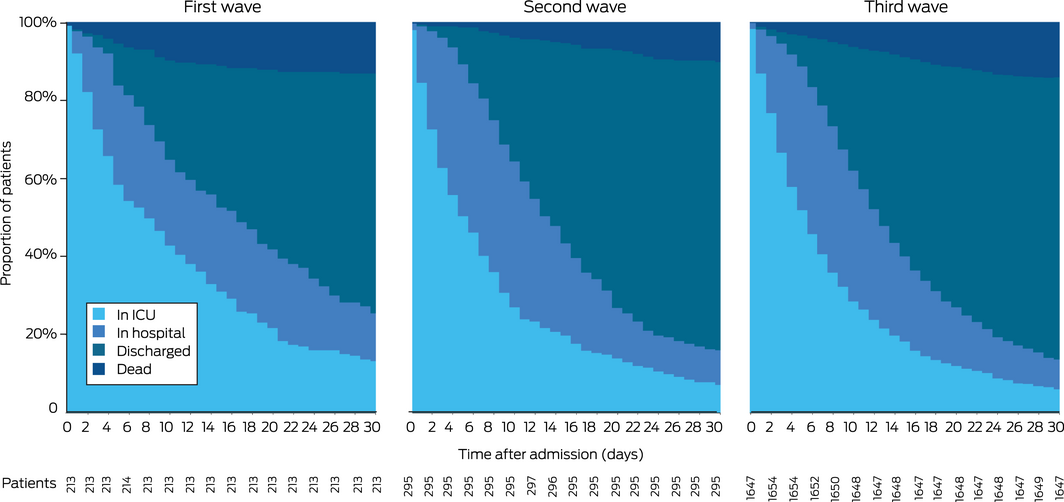
COVID‐19 = coronavirus disease 2019; SPRINT‐SARI = Short Period Incidence Study of Severe Acute Respiratory Infection.
* First wave: ICU admissions during 27 February – 30 June 2020; second wave: 1 July 2020 – 25 June 2021; third wave: 26 June 2021 – 1 November 2021.
Box 8 – Exponentially weighted moving average (EWMA) plots of mortality risk by time, and numbers of patients with COVID‐19 in SPRINT‐SARI intensive care units (ICUs) with COVID‐19, 27 February 2020 – 1 November 2021: overall and by need for ventilation, by ICU admission date
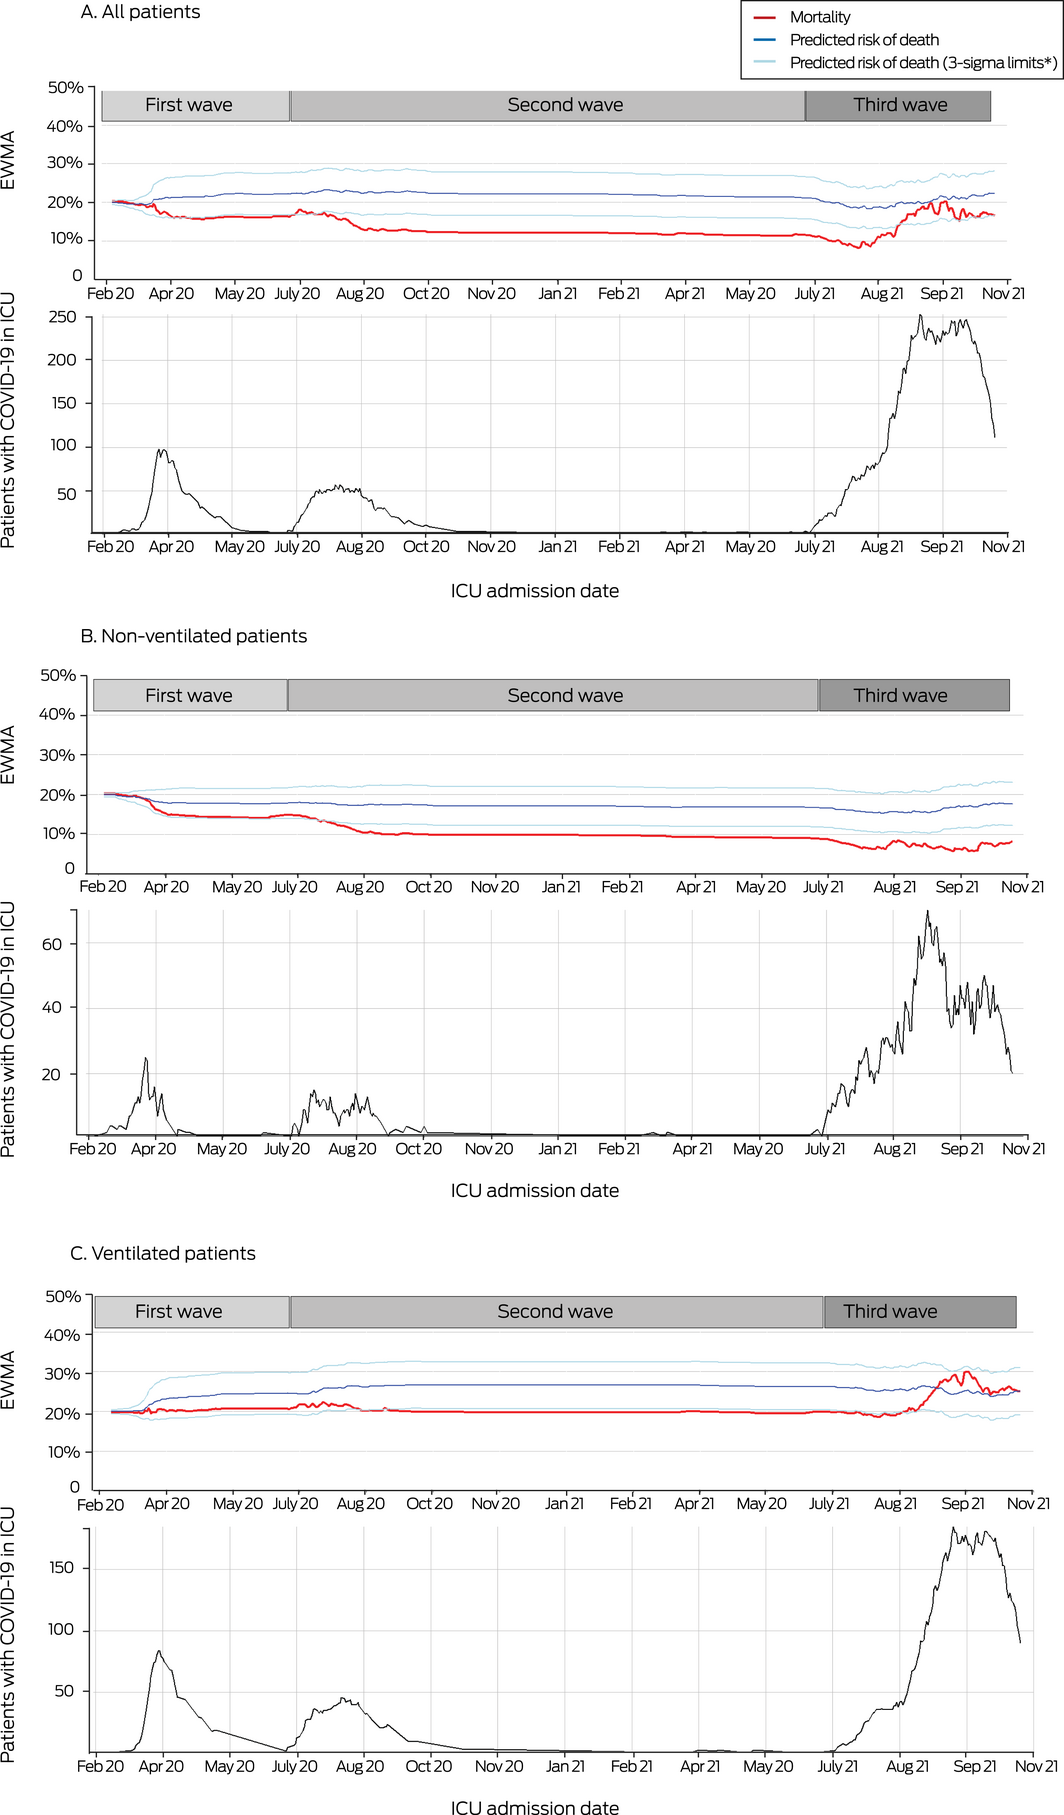
* Boundaries of predicted risk of death (three standard deviations of EWMA, with weight of 0.005). The predicted risk of death was derived from admission APACHE II scores, with admission attributed to respiratory infection.
Received 10 January 2022, accepted 23 March 2022
- Husna Begum1
- Ary S Neto2
- Patricia Alliegro3
- Tessa Broadley1
- Tony Trapani1,3
- Lewis T Campbell4,5
- Allen C Cheng1
- Winston Cheung6
- D James Cooper1,2,3
- Simon J Erickson7
- Craig J French8
- Edward Litton9
- Richard McAllister10
- Alistair Nichol1,3
- Annamaria Palermo9,11
- Mark P Plummer12
- Hannah Rotherham12
- Mahesh Ramanan13,14
- Benjamin Reddi15
- Claire Reynolds16
- Steven AR Webb17
- Andrew A Udy1,2
- Aidan Burrell3
- 1 Monash University, Melbourne, VIC
- 2 Australian and New Zealand Intensive Care Research Centre, Melbourne, VIC
- 3 Alfred Health, Melbourne, VIC
- 4 Royal Darwin Hospital, Darwin, NT
- 5 Menzies School of Health Research, Darwin, NT
- 6 Concord Repatriation General Hospital, Sydney, NSW
- 7 Princess Margaret Hospital for Children, Perth, WA
- 8 Western Heath, Melbourne, VIC
- 9 Fiona Stanley Hospital, Perth, WA
- 10 Royal Hobart Hospital, Hobart, TAS
- 11 St John of God Health Care, Perth, WA
- 12 Royal Melbourne Hospital, Melbourne, VIC
- 13 Prince Charles Hospital, Brisbane, QLD
- 14 Caboolture Hospital, Caboolture, QLD
- 15 Royal Adelaide Hospital, Adelaide, SA
- 16 St Vincent's Hospital, Sydney, NSW
- 17 University of Western Australia, Perth, WA
Open access
Open access publishing facilitated by Monash University, as part of the Wiley ‐ Monash University agreement via the Council of Australian University Librarians.
We thank the SPRINT‐SARI Australia investigators and all participating institutions (see full list at the end of the Supporting Information file).
No relevant disclosures.
- 1. Perkins GD, Ji C, Connolly BA, et al. An adaptive randomized controlled trial of non‐invasive respiratory strategies in acute respiratory failure patients with COVID‐19 [preprint]. medRxiv 2021.08.02.21261379; 4 Aug 2021. https://doi.org/10.1101/2021.08.02.21261379 (viewed Dec 2021).
- 2. REMAP‐CAP Investigators; Gordon AC, Mouncey PR, Al‐Beidh F, et al. Interleukin‐6 receptor antagonists in critically ill patients with Covid‐19. N Engl J Med 2021; 384: 1491‐1502.
- 3. Isaric Clinical Characterisation Group, Kartsonaki C. Characteristics and outcomes of an international cohort of 400,000 hospitalised patients with COVID‐19 [preprint]. medRxiv 2021.09.11.21263419; 21 Sept 2021. https://doi.org/10.1101/2021.09.11.21263419 (viewed Dec 2021).
- 4. Trauer JM, Lydeamore MJ, Dalton GW, et al. Understanding how Victoria, Australia gained control of its second COVID‐19 wave. Nature Commun 2021; 12: 6266.
- 5. Price DJ, Shearer FM, Meehan MT, et al. Early analysis of the Australian COVID‐19 epidemic. Elife 2020; 9: e58785.
- 6. Burrell AJ, Pellegrini B, Salimi F, et al. Outcomes for patients with COVID‐19 admitted to Australian intensive care units during the first four months of the pandemic. Med J Aust 2021; 214: 23‐30. https://www.mja.com.au/journal/2021/214/1/outcomes‐patients‐covid‐19‐admitted‐australian‐intensive‐care‐units‐during‐first
- 7. Burrell AJ, Neto AS, Broadley T, et al; the SPRINT SARI Australia Investigators. Comparison of baseline characteristics, treatment and clinical outcomes of critically ill COVID‐19 patients admitted in the first and second waves in Australia. Crit Care Resusc 2021; 23: 308‐319.
- 8. Ying L, Joacim R. The reproductive number of the Delta variant of SARS‐CoV‐2 is far higher compared to the ancestral SARS‐CoV‐2 virus. J Travel Med 2021; 28: taab124.
- 9. Pilcher P, Coatsworth NR, Rosenow M, McClure J. A national system for monitoring intensive care unit demand and capacity: the Critical Health Resources Information System (CHRIS). Med J Aust 2021; 214: 297‐298.e1. https://www.mja.com.au/journal/2021/214/7/national‐system‐monitoring‐intensive‐care‐unit‐demand‐and‐capacity‐critical
- 10. Austin PC, Fine JP. Practical recommendations for reporting Fine–Gray model analyses for competing risk data. Stat Med 2017; 36: 4391‐4400.
- 11. Bates D, Mächler M, Bolker B, Walker S. Fitting linear mixed‐effects models using lme4. Journal of Statistical Software 2015; 67: https://doi.org/10.18637/jss.v067.i01.
- 12. Koenker R. Quantile regression in R: a vignette. 28 June 2019. https://cran.r‐project.org/web/packages/quantreg/vignettes/rq.pdf (viewed Mar 2022).
- 13. Sukparungsee S, Areepong Y, Taboran R. Exponentially weighted moving average‐moving average charts for monitoring the process mean. PLoS One 2020; 15: e0228208.
- 14. Ong SWX, Chiew CJ, Ang LW, et al. Clinical and virological features of SARS‐CoV‐2 variants of concern: a retrospective cohort study comparing B.1.1.7 (Alpha), B.1.315 (Beta), and B.1.617.2 (Delta). Clin Infec Dis 2021; https://doi.org/10.1093/cid/ciab721 [Online ahead of print].
- 15. Twohig KA, Nyberg T, Zaidi A, et al; COVID‐19 Genomics UK (COG‐UK) consortium. Hospital admission and emergency care attendance risk for SARS‐CoV‐2 delta (B.1.617.2) compared with alpha (B.1.1.7) variants of concern: a cohort study. Lancet Infect Dis 2021; 22: 35‐42.
- 16. Public Health England. SARS‐CoV‐2 variants of concern and variants under investigation in England (Technical briefing 16). 18 June 2021. https://assets.publishing.service.gov.uk/government/uploads/system/uploads/attachment_data/file/994839/Variants_of_Concern_VOC_Technical_Briefing_16.pdf (viewed Dec 2021).
- 17. Khedar RS, Mittal K, Ambaliya HC, et al. Greater COVID‐19 severity and mortality in hospitalized patients in second (delta variant) wave compared to the first: single centre prospective study in India [preprint]. medRxiv 2021.09.03.21263091; 7 Sept 2021. https://doi.org/10.1101/2021.09.03.21263091 (viewed Dec 2021).
- 18. Iftimie S, López‐Azcona AF, Vallverdú I, et al. First and second waves of coronavirus disease‐19: a comparative study in hospitalized patients in Reus, Spain. PLoS One 2021; 16: e0248029.
- 19. Shah SA, Moore E, Robertson C, et al; Public Health Scotland and the EAVE II Collaborators. Predicted COVID‐19 positive cases, hospitalisations, and deaths associated with the Delta variant of concern. Lancet Digit Health 2021; 3: e539‐e541.
- 20. Public Health England. SARS‐CoV‐2 variants of concern and variants under investigation in England (Technical Briefing 11). 13 May 2021. https://assets.publishing.service.gov.uk/government/uploads/system/uploads/attachment_data/file/986380/Variants_of_Concern_VOC_Technical_Briefing_11_England.pdf (viewed Dec 2021).
- 21. European Centre for Disease Prevention and Control. Threat assessment brief: emergence of SARS‐CoV‐2 B.1.617 variants in India and situation in the EU/EEA. 11 May 2021. https://www.ecdc.europa.eu/en/publications‐data/threat‐assessment‐emergence‐sars‐cov‐2‐b1617‐variants (viewed Nov 2021).
- 22. Ontario Agency for Health Protection and Promotion (Public Health Ontario). COVID‐19: severity of the Delta (B.1.617.2) variant in children. 17 Aug 2021. https://www.publichealthontario.ca/‐/media/documents/ncov/voc/2021/09/covid‐19‐severity‐delta‐children.pdf?sc_lang=en (viewed Dec 2021).
- 23. Hoogenboom WS, Pham A, Anand H, et al. Clinical characteristics of the first and second COVID‐19 waves in the Bronx, New York: a retrospective cohort study. Lancet Reg Health Am 2021; 3: 100041.
- 24. Ontario Agency for Health Protection and Promotion (Public Health Ontario). COVID‐19 Delta: risk assessment and implications for public health measures. 30 June 2021. https://www.publichealthontario.ca/‐/media/documents/ncov/voc/2021/07/covid‐19‐delta‐risk‐analysis‐public‐health‐measures.pdf?sc_lang=en (viewed Dec 2021).
- 25. Martinez‐Portilla RJ, Sotiriadis A, Chatzakis C, et al. Pregnant women with SARS‐CoV‐2 infection are at higher risk of death and pneumonia: propensity score matched analysis of a nationwide prospective cohort (COV19Mx). Ultrasound Obstet Gynecol 2021; 57: 224‐231.
- 26. Litton E, Huckson S, Chavan S, et al. Increasing ICU capacity to accommodate higher demand during the COVID‐19 pandemic. Med J Aust 2021; 215: 513‐517. https://www.mja.com.au/journal/2021/215/11/increasing‐icu‐capacity‐accommodate‐higher‐demand‐during‐covid‐19‐pandemic
- 27. Wilde H, Mellan T, Hawryluk I, et al. The association between mechanical ventilator compatible bed occupancy and mortality risk in intensive care patients with COVID‐19: a national retrospective cohort study. BMC Med 2021; 19: 213.
- 28. Pereira CCA, Martins M, Lima SML, et al. Geographical variation in demand, utilization, and outcomes of hospital services for COVID‐19 in Brazil: a descriptive serial cross‐sectional study. PLoS One 2021; 16: e0257643.
Abstract
Objective: To compare the demographic and clinical features, management, and outcomes for patients admitted with COVID‐19 to intensive care units (ICUs) during the first, second, and third waves of the pandemic in Australia.
Design, setting, and participants: People aged 16 years or more admitted with polymerase chain reaction‐confirmed COVID‐19 to the 78 Australian ICUs participating in the Short Period Incidence Study of Severe Acute Respiratory Infection (SPRINT‐SARI) Australia project during the first (27 February – 30 June 2020), second (1 July 2020 – 25 June 2021), and third COVID‐19 waves (26 June – 1 November 2021).
Main outcome measures: Primary outcome: in‐hospital mortality. Secondary outcomes: ICU mortality; ICU and hospital lengths of stay; supportive and disease‐specific therapies.
Results: 2493 people (1535 men, 62%) were admitted to 59 ICUs: 214 during the first (9%), 296 during the second (12%), and 1983 during the third wave (80%). The median age was 64 (IQR, 54–72) years during the first wave, 58 (IQR, 49–68) years during the second, and 54 (IQR, 41–65) years during the third. The proportion without co‐existing illnesses was largest during the third wave (41%; first wave, 32%; second wave, 29%). The proportion of ICU beds occupied by patients with COVID‐19 was 2.8% (95% CI, 2.7–2.9%) during the first, 4.6% (95% CI, 4.3–5.1%) during the second, and 19.1% (95% CI, 17.9–20.2%) during the third wave. Non‐invasive (42%v 15%) and prone ventilation strategies (63% v 15%) were used more frequently during the third wave than during the first two waves. Thirty patients (14%) died in hospital during the first wave, 35 (12%) during the second, and 281 (17%) during the third. After adjusting for age, illness severity, and other covariates, the risk of in‐hospital mortality was similar for the first and second waves, but 9.60 (95% CI, 3.52–16.7) percentage points higher during the third than the first wave.
Conclusion: The demographic characteristics of patients in intensive care with COVID‐19 and the treatments they received during the third pandemic wave differed from those of the first two waves. Adjusted in‐hospital mortality was highest during the third wave.