


The known: People with intellectual disability face stark health inequalities and barriers to health care. Overseas, their rates of potentially preventable hospitalisation are higher than for people without intellectual disability. These rates have not been assessed in Australia.
The new: Rates of potentially preventable hospitalisation are higher in NSW for people with intellectual disability than for the general population, particularly hospitalisations for acute conditions, including convulsions and epilepsy.
The implications: The frequency of potentially preventable hospitalisation of people with intellectual disability should be reduced. This will require determining the reasons for such admissions, and overcoming barriers to adequate care in the community.
People with intellectual disability face stark health inequalities, as featured prominently in the recent hearings of the Royal Commission into Violence, Abuse, Neglect and Exploitation of People with Disability.1 Both multimorbidity2 and premature and potentially avoidable death3 are more frequent among people with intellectual disability. One of the aims of the National Disability Strategy (2010–2020) was to ensure that people in Australia with disabilities attain the greatest possible health and wellbeing throughout their lives.4 While the federal government has committed to some action through the National Roadmap for Improving the Health of Australians with Intellectual Disability,5 important deficiencies remain, including the exclusion of people with intellectual disability from the National Preventative Health Strategy.6 This exclusion may contribute to the fact that primary care for Australians with intellectual disability is dominated by administrative needs, such as documentation, at the expense of meeting their medical and preventive health care needs.7
One marker of poor access to appropriate primary and community‐based health care is the higher rate of potentially preventable hospitalisations for people with intellectual disability than for people without intellectual disability, as reported overseas.8,9,10,11 In Australia, potentially preventable hospitalisations are a performance indicator of health care accessibility and effectiveness; twenty‐two ambulatory care‐sensitive conditions are encompassed by this indicator, including vaccine‐preventable, acute, and chronic conditions.12 One strength of this indicator is that it can be used to assess the needs of people with specific conditions or to identify the greatest burden for particular population subgroups. However, people with intellectual disability in Australia cannot be identified in the standard data collected on potentially preventable hospitalisations, hindering identification of priority health areas for this group, despite its recognised health disadvantages.
We aimed to address this gap in knowledge by using a linked administrative dataset to estimate the rates of potentially preventable hospitalisations of people with intellectual disability in New South Wales, and to compare it with rates for the general NSW population.
Methods
We undertook a retrospective cohort study, analysing two population datasets. For people with intellectual disability, we analysed information from a retrospective data linkage study of 92 542 people with intellectual disability in NSW, based on data collected during 1 July 2001 – 30 June 2015.13 Data for the overall NSW population (as the comparison group) was derived from information on potentially preventable hospitalisations published by HealthStats NSW.14 We included data without restrictions on age group.
As previously described,13 people with intellectual disability were defined in our linked datasets by the presence of a Diagnostic and Statistical Manual of Mental Disorders (DSM) IV diagnostic code for intellectual disability in at least one disability dataset, or an equivalent International Statistical Classification of Diseases (ICD‐10) diagnostic code in their health record. The ICD‐10 codes included childhood disintegrative and overactive disorders associated with mental retardation, intellectual development delay, mild to profound mental retardation, Down syndrome and other chromosomal anomalies associated with mental retardation, fragile X syndrome, and congenital malformation syndromes with known exogenous causes.
Potentially preventable hospitalisations were identified using the definition in the National Healthcare Agreement, progress indicator (PI) 18 (online Supporting Information, table 1).12 For the intellectual disability group, data for four of the twenty‐two conditions were unavailable in the linkage data (congestive cardiac failure, angina, hypertension, cellulitis), so we also excluded HealthStats NSW data for these four conditions.
Statistical analysis
Rates of potentially preventable hospitalisation of people with intellectual disability were adjusted for age applying the direct standardised method with the standard Australian population.15 HealthStats NSW rates had already been age‐adjusted with this method.
We compared the overall rates of potentially preventable hospitalisation of people with intellectual disability with those for the general NSW population as rate ratios (RRs) with 95% confidence intervals (CIs).16 We also compared the rates between 2001–02 and 2014–15 for each of the three hospitalisation subcategories (vaccine‐preventable, acute, chronic).
We extracted the combined data for 2010–11 to 2014–15 and calculated the rates of potentially preventable hospitalisation by age and conditions, and compared the rates for people with intellectual disability and the general NSW population as RRs.
Ethics approval
The study was approved by the NSW Population and Health Services Research Ethics Committee (HREC/13/CIPHS/7; Cancer Institute NSW reference: 2013/02/446).
Results
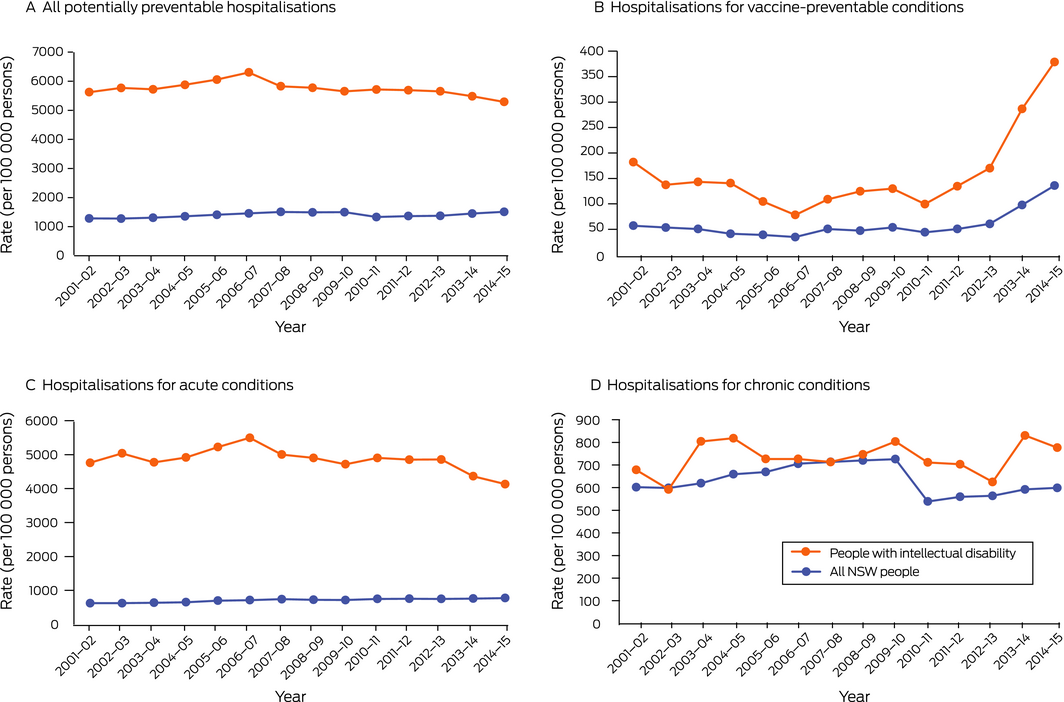
Between 2001–02 and 2014–15, the age‐standardised rate of potentially preventable hospitalisations of people with intellectual disability ranged between 5286 and 6301 per 100 000 persons; the age‐standardised rate for the NSW population ranged between 1278 and 1511 per 100 000 persons. RRs ranged between 3.5 (95% CI, 3.3–3.7) in 2014–15 and 4.5 (95% CI, 4.2–4.9) in 2002–03 (Box 1, Box 2, A; Supporting Information, table 2).
Potentially preventable hospitalisations, by condition type
RRs for potentially preventable hospitalisations for vaccine‐preventable conditions ranged between 2.1 (95% CI, 1.6–3.0) in 2007–08 and 3.4 (95% CI, 2.2–5.2) in 2004–05 (Box 1, Box 2, B; Supporting Information, table 2). For acute conditions, RRs ranged between 5.3 (95% CI, 4.9–5.7) in 2014–15 and 8.1 (95% CI, 7.4–8.8) in 2002–03 (Box 1, Box 2, C; Supporting Information, table 2). For chronic conditions, RRs ranged between 1.0 (for several years) and 1.4 (95% CI, 1.2–1.6) in 2013–14 (Box 1, Box 2, D; Supporting Information, table 2).
Potentially preventable hospitalisations, by condition
Convulsions/epilepsy was the most frequent indication for potentially avoidable hospitalisations of people with intellectual disability in all age groups, with the exception of 65 years or more (all ages: 2567 per 100 000 persons; range, 279 [15‒24 years] to 636 per 100 000 persons [25‒44 years]), followed by dental conditions (all ages: 1185 per 100 000 persons; range, 148 [15‒24 years] to 428 per 100 000 persons [25‒44 years]) (Box 3; Supporting Information, table 3).
In each age group, the difference in rates of potentially avoidable hospitalisations for people with intellectual disability and for the general NSW population was greatest for convulsions or epilepsy (all ages: RR, 22.2; 95% CI, 21.3–23.1). The second greatest differences were for bronchiectasis for people aged 0‒14 years (RR, 10.0; 95% CI, 4.1–24.7), 15‒24 years (RR, 14.5; 95% CI, 5.2–40.5), or 25‒44 years (RR, 11.7; 95% CI, 4.6–29.7), dental conditions for people aged 45‒64 years (RR, 6.4; 95% CI, 5.4–7.5), and pelvic inflammatory disease for people aged 65 years or more (RR, 9.0; 95% CI, 1.2–64.7) (Box 3; Supporting Information, table 3).
In each age group, potentially avoidably hospitalisations of people with intellectual disability for asthma were less frequent than for the general NSW population (all ages: RR, 0.4; 95% CI, 0.4–0.4). People with intellectual disability aged 0‒14 years (RR, 0.2; 95% CI, 0.1–0.2) or 15‒24 years (no admissions) were also less frequently hospitalised for non‐vaccine‐preventable pneumonia (Box 3; Supporting Information, table 3).
Discussion
In the first Australian study of potentially preventable hospitalisations of people with intellectual disability, we found that age‐standardised rates were higher than for the general NSW population, without clear patterns of change in differences during 2001‒2015. Our findings are in line with findings from Canada, the United States of America, and the United Kingdom that rates of potentially preventable hospitalisation are higher for people with intellectual disability.8,9,10,11 We found that rates were particularly high for hospitalisations for acute conditions, for which overall rates were five to eight times as high for people with intellectual disability as for the general population; the rates for admissions with vaccine‐preventable conditions were about three times as high. Differences in rates between people with intellectual disability and the general population were greatest for admissions related to convulsions and epilepsy, and were also substantially higher for dental conditions and bronchiectasis, but lower for asthma.
To avert potentially preventable hospitalisations, understanding their main drivers is critical, but there is a dearth of research in this area for the general population, and even less regarding people with intellectual disability. Socio‐demographic factors and comorbid conditions can influence rates of potentially preventable hospitalisation of people with intellectual disability.8,11,17 Research into the accessibility of health care has identified a range of factors that may contribute to elevated rates for people with intellectual disability, including poor uptake and engagement with preventive health care,18 a primary health care system driven by administrative rather than medical and preventive health factors,7 and general practitioners lacking confidence in providing health care for people with intellectual disability.19 Drivers of potentially preventable hospitalisations of people from the general population include inadequate access to health and other support services, lack of family and social support, non‐adherence to treatment, mental ill health, and poor awareness or understanding of health conditions.20,21 Whether these factors are also important for people with intellectual disability requires further investigation, as does determining the proportion of reportedly potentially preventable hospitalisations that are actually appropriate.
We found that convulsions/epilepsy was the leading indication for potentially preventable hospitalisations of people with intellectual disability, consistent with an earlier report that hospital admissions for epilepsy were 54 times as frequent for people with intellectual disability than for other people.8 One explanation for this finding would be that a larger proportion of people with intellectual disability have epilepsy than the general population. A recent systematic review found that about 22% of people with intellectual disability have epilepsy, and that its prevalence increases with the severity of their disability.22
We had no information about why people with intellectual disability were hospitalised with convulsions and epilepsy, or whether these hospitalisations were avoidable. A study in Western Australia found that adults with intellectual disability were more than nine times as likely to die as the result of convulsions and epilepsy as adults without intellectual disability.23 Guidance for managing epilepsy in people with intellectual disability is available, but robust research that could inform service responses to people with both intellectual disability and epilepsy, including how unnecessary hospital admissions can be averted, is needed,24 as is investigation of the capacity of the health care workforce to meet their needs. In light of our findings, and the prevalence of epilepsy among people with intellectual disability, it is important to assist primary and community‐‐based health care providers to provide appropriate care.
In our study, avoidable admissions of people with intellectual disability with vaccine‐preventable conditions were about three times as frequent as for the general population, particularly with influenza and pneumonia. A recent report for the National Disability Insurance Scheme Quality and Safeguards Commission co‐authored by one of the authors (JT) identified low vaccination coverage as a potential contributor to mortality in disability care; 14‒48% of people with a disability had not received an influenza vaccine in the 12 months preceding their deaths, and 25‒83% had not received a pneumococcal vaccine.25 Vaccination rates among people with intellectual disability have been little investigated. A recent study found that vaccination coverage among UK children with intellectual disability were lower than among other children,26 and vaccination coverage for hepatitis B and influenza among children and adolescents with intellectual disability in Taiwan was also lower than for those without intellectual disability.27,28 A recent review that more broadly examined vaccination status in people with disability found that knowledge in this area was inadequate.29 Our findings highlight the need to better understand vaccination uptake by people with intellectual disability, the reasons for their incomplete vaccination coverage throughout life, and why vaccine‐preventable conditions are leading to their hospitalisation.
We also found higher rates of potentially preventable hospitalisations for dental conditions. People with intellectual disability have poorer oral health than other people, and probably also receive less preventive dental care and have poorer access to dental services.30 A review found that barriers to access to dental services for children with intellectual disability included physical inaccessibility, the poor dental health literacy of carers, and dental health workers lacking knowledge, experience, and skills regarding people with intellectual disability.31 Removing these barriers may reduce the number of people with intellectual disability unnecessarily admitted to hospital with dental conditions.
The lower rate of preventable admissions for asthma is interesting, as asthma rates for people with intellectual disability are thought to be comparable with or higher than rates for people without intellectual disability,32 and adults with intellectual disability are more likely to die as the result of asthma than other people.23 Our findings also contrast with those of an earlier study that people with intellectual disability, after adjusting for age, sex, region, and disease prevalence, were twice as likely to be admitted to hospital with asthma.8
Strengths and limitations
We analysed data drawn from large samples and directly compared age‐adjusted rates of potentially preventable hospitalisations for people with intellectual disability and the overall NSW population. However, we could not include four of the conditions used to define potentially preventable hospitalisation in Australia. Further, we applied this definition rather than the specific definition for people with intellectual disability employed by other authors.8 We could not analyse our data by the severity of intellectual disability, adjust for the relative prevalence of the included conditions in people with intellectual disability and in the general population, or explore the reasons for differences in rates of potentially preventable hospitalisations throughout life.
Conclusion
Our findings indicate that people with intellectual disability are hospitalised for conditions that could be managed in the community at higher rates than people without intellectual disability. This conclusion could not have been reached by directly assessing medical records, as intellectual disability status is not adequately recorded in Australian medical health records. Our findings provide additional evidence that the Australian health care system, particularly primary and community health care, are not sufficiently equipped to meet the complex health care needs of people with intellectual disability. Systemic action to remedy this problem could include a national population health strategy for people with intellectual disability, reforming Australian health care and improving the capacity of health care providers to meet their needs, and improving the health literacy of people with intellectual disability and people in their support networks.
Box 1 – Rate ratios (with 95% confidence intervals) for potentially preventable hospitalisations (per 100 000 persons) of New South Wales people with intellectual disability and of all New South Wales people, by year*
|
Year |
All conditions |
Vaccine‐preventable conditions |
Chronic conditions |
Acute conditions |
|||||||||||
|
|
|||||||||||||||
|
2001–02 |
4.4 (4.1–4.7) |
3.2 (2.2–4.7) |
1.1 (1.0–1.3) |
7.6 (6.9–8.4) |
|||||||||||
|
2002–03 |
4.5 (4.2–4.9) |
2.6 (1.7–3.8) |
1.0 (0.8–1.2) |
8.1 (7.4–8.8) |
|||||||||||
|
2003–04 |
4.4 (4.1–4.7) |
2.8 (2.1–3.8) |
1.3 (1.1–1.5) |
7.5 (6.8–8.2) |
|||||||||||
|
2004–05 |
4.3 (4.0–4.7) |
3.4 (2.2–5.2) |
1.2 (1.1–1.4) |
7.5 (6.9–8.2) |
|||||||||||
|
2005–06 |
4.3 (4.0–4.6) |
2.7 (1.8–4.1) |
1.1 (0.9–1.3) |
7.5 (6.9–8.1) |
|||||||||||
|
2006–07 |
4.3 (4.1–4.6) |
2.2 (1.5–3.4) |
1.0 (0.9–1.2) |
7.7 (7.1–8.4) |
|||||||||||
|
2007–08 |
3.9 (3.6–4.1) |
2.1 (1.6–3.0) |
1.0 (0.9–1.1) |
6.8 (6.2–7.3) |
|||||||||||
|
2008–09 |
3.9 (3.6–4.1) |
2.6 (1.8–3.9) |
1.0 (0.9–1.2) |
6.8 (6.2–7.4) |
|||||||||||
|
2009–10 |
3.8 (3.5–4.0) |
2.4 (1.8–3.2) |
1.1 (1.0–1.3) |
6.6 (6.1–7.1) |
|||||||||||
|
2010–11 |
4.3 (4.0–4.6) |
2.3 (1.6–3.1) |
1.3 (1.1–1.5) |
6.5 (6.0–7.1) |
|||||||||||
|
2011–12 |
4.2 (3.9–4.4) |
2.7 (1.9–3.7) |
1.3 (1.1–1.4) |
6.4 (6.0–6.9) |
|||||||||||
|
2012–13 |
4.1 (3.9–4.4) |
2.8 (2.1–3.7) |
1.1 (1.0–1.3) |
6.5 (6.0–7.0) |
|||||||||||
|
2013–14 |
3.8 (3.6–4.0) |
2.9 (2.3–3.8) |
1.4 (1.2–1.6) |
5.7 (5.3–6.2) |
|||||||||||
|
2014–15 |
3.5 (3.3–3.7) |
2.8 (2.2–3.5) |
1.3 (1.1–1.5) |
5.3 (4.9–5.7) |
|||||||||||
|
|
|||||||||||||||
|
* All age‐adjusted rates of potentially preventable hospitalisations by category and year are available in the online Supporting Information, table 2. |
|||||||||||||||
Box 2 – Age‐adjusted rates of potentially preventable hospitalisations, New South Wales, 2001–02 to 2014–15
Box 3 – Rate ratios (with 95% confidence intervals) for potentially preventable hospitalisations (per 100 000 persons) of New South Wales people with intellectual disability and of all New South Wales people, 2010‒11 to 2014‒15, by age and condition*
|
Condition |
All ages |
0–14 years |
15–24 years |
25–44 years |
45–64 years |
65 years or more |
|||||||||
|
|
|||||||||||||||
|
Vaccine‐preventable |
|
|
|
|
|
|
|||||||||
|
Pneumonia and influenza |
2.9 |
4.8 |
3.9 |
4.2 |
3.3 |
1.4 |
|||||||||
|
Other |
2.6 |
2.1 |
1.7 |
2.7 |
2.7 |
2.7 |
|||||||||
|
Chronic conditions† |
|
|
|
|
|
|
|||||||||
|
Asthma |
0.4 |
0.1 |
0.3 |
0.3 |
0.4 |
0.2 |
|||||||||
|
Bronchiectasis |
2.6 |
10.0 |
14.5 |
11.7 |
1.9 |
1.2 |
|||||||||
|
Chronic obstructive pulmonary disease |
2.2 |
3.0 |
5.1 |
5.3 |
2.9 |
2.0 |
|||||||||
|
Iron deficiency anaemia |
1.8 |
3.3 |
1.3 |
1.9 |
1.8 |
1.2 |
|||||||||
|
Rheumatic heart diseases |
1.2 |
2.1 |
1.7 |
1.6 |
0.8 |
0 |
|||||||||
|
Acute conditions‡ |
|
|
|
|
|
|
|||||||||
|
Convulsions and epilepsy |
22.2 |
14.8 |
22.6 |
25.7 |
25.4 |
11.9 |
|||||||||
|
Dental conditions |
5.6 |
3.1 |
7.2 |
11.1 |
6.4 |
2.3 |
|||||||||
|
Ear, nose, throat infections |
2.8 |
2.5 |
1.5 |
2.4 |
3.6 |
2.2 |
|||||||||
|
Pelvic inflammatory disease |
0.8 |
1.2 |
0.6 |
0.8 |
0.2 |
9.0 |
|||||||||
|
Perforated/bleeding ulcer |
1.8 |
2.7 |
1.6 |
1.6 |
2.7 |
1.4 |
|||||||||
|
Pneumonia (not vaccine‐preventable) |
1.0 |
0.2 |
0 |
1.9 |
2.3 |
1.7 |
|||||||||
|
Urinary tract infections |
3.4 |
2.4 |
2.2 |
4.1 |
5.3 |
2.6 |
|||||||||
|
|
|||||||||||||||
|
* All age‐adjusted rates of potentially preventable hospitalisations by category and year are available in the online Supporting Information, table 3. † Data for diabetes complications and nutritional deficiencies not included because of small case numbers. ‡ Data for eclampsia and gangrene not included because of small case numbers. The category "Convulsions and epilepsy" is included under acute conditions in the National Healthcare Agreement list of potentially preventable hospitalisations.12 |
|||||||||||||||
Received 31 August 2020, accepted 23 February 2021
- Janelle C Weise
- Preeyaporn Srasuebkul
- Julian N Trollor
- University of New South Wales, Sydney, NSW
Julian Trollor is supported as the Chair of Intellectual Disability Mental Health at the University of New South Wales by Ageing Disability and Home Care, Family and Community Services NSW, and the Mental Health Branch, the NSW Ministry of Health.
No relevant disclosures.
- 1. Royal Commission into Violence, Abuse, Neglect and Exploitation of People with Disability. Public hearing 4: Healthcare for people with cognitive disability [report]. 20 Oct 2020. https://disability.royalcommission.gov.au/publications/report-public-hearing-4-healthcare-people-cognitive-disability (viewed May 2021).
- 2. Cooper SA, McLean G, Guthrie B, et al. Multiple physical and mental health comorbidity in adults with intellectual disabilities: population-based cross-sectional analysis. BMC Fam Pract 2015; 16: 110.
- 3. Trollor J, Srasuebkul P, Xu H, Howlett S. Cause of death and potentially avoidable deaths in Australian adults with intellectual disability using retrospective linked data. BMJ Open 2017; 7: e013489.
- 4. Council of Australian Governments. National Disability Strategy 2010‒2020. 2011. https://www.dss.gov.au/our-responsibilities/disability-and-carers/publications-articles/policy-research/national-disability-strategy-2010-2020 (viewed May 2021).
- 5. Australian Department of Health. National roadmap for improving the health of Australians with intellectual disability. Updated 4 Oct 2019. https://www1.health.gov.au/internet/main/publishing.nsf/Content/national-roadmap-for-improving-the-health-of-Australians-with-intellectual-disability (viewed May 2021).
- 6. National Preventative Health Taskforce. Australia: the healthiest country by 2020. National preventative health strategy: the roadmap for action. June 2009. https://apo.org.au/sites/default/files/resource-files/2009-06/apo-nid241341.pdf (viewed May 2021).
- 7. Weise J, Pollack A, Britt H, Trollor JN. Primary health care for people with an intellectual disability: an exploration of demographic characteristics and reasons for encounters from the BEACH programme. J Intellect Disabil Res 2016; 60: 1119–1127.
- 8. Balogh R, Brownell M, Ouellette-Kuntz H, Colantonio O. Hospitalisation rates for ambulatory care sensitive conditions for persons with and without an intellectual disability: a population perspective. J Intellect Disabil Res 2010; 54: 820–832.
- 9. Dunn K, Hughes-McCormack L, Cooper SA. Hospital admissions for physical health conditions for people with intellectual disabilities: systematic review. J Appl Res Intellect Disabil 2018; 31 (Suppl 1): 1–10.
- 10. Glover G, Williams R, Oyinlola J. An observational cohort study of numbers and causes of preventable general hospital admissions in people with and without intellectual disabilities in England. J Intellect Disabil Res 2020; 64: 331–344.
- 11. Hand BN, Boan AD, Bradley CC, et al. Ambulatory care sensitive admissions in individuals with autism spectrum disorder, intellectual disability, and population controls. Autism Res 2019; 12: 295–302.
- 12. Australian Institute of Health and Welfare. National healthcare agreement: PI 18. Selected potentially preventable hospitalisations, 2018. https://meteor.aihw.gov.au/content/index.phtml/itemId/658499 (viewed Apr 2021).
- 13. Reppermund S, Srasuebkul P, Heintze T, et al. Cohort profile: a data linkage cohort to examine health service profiles of people with intellectual disability in New South Wales, Australia. BMJ Open 2017; 7: e015627.
- 14. HealthStats NSW. Public potentially preventable hospitalisations data. Updated 10 Mar 2020. http://www.healthstats.nsw.gov.au/Indicator/bod_acshos (viewed July 2020).
- 15. Australian Bureau of Statistics. 3101.0. Australian demographic statistics. Mar 2013. Which population to use for age standardisation? Sept 2013. https://www.abs.gov.au/AUSSTATS/abs@.nsf/Previousproducts/3101.0Feature%20Article1Mar%202013?opendocument&tabname=Summary&prodno=3101.0&issue=Mar%202013&num=&view= (viewed May 2021).
- 16. Boyle P, Parkin DM. Cancer registration: principles and methods. Statistical methods for registries. IARC Sci Publ 1991; (95): 126–158.
- 17. Balogh R, Ouellette-Kuntz H, Brownell M, Colantonio A. Factors associated with hospitalisations for ambulatory care-sensitive conditions among persons with an intellectual disability: a publicly insured population perspective. J Intellect Disabil Res 2013; 57: 226–239.
- 18. Williamson HJ, Contreras GM, Rodriguez ES, et al. Health care access for adults with intellectual and developmental disabilities: a scoping review. OTJR (Thorofare N J) 2017; 37: 227–236.
- 19. Lennox N, Diggens J, Ugoni A. Health care for people with an intellectual disability: general practitioners’ attitudes, and provision of care. J Intellect Dev Disabil 2000; 25: 127–133.
- 20. Longman JM, Rix E, Johnston JJ, Passey ME. Ambulatory care sensitive chronic conditions: what can we learn from patients about the role of primary health care in preventing admissions? Aust J Prim Health 2018; 24: 304–310.
- 21. van Loenen T, van den Berg MJ, Westert GP, Faber MJ. Organizational aspects of primary care related to avoidable hospitalization: a systematic review. Fam Pract 2014; 31: 502–516.
- 22. Robertson J, Hatton C, Emerson E, Baines S. Prevalence of epilepsy among people with intellectual disabilities: a systematic review. Seizure 2015; 29: 46–62.
- 23. Brameld K, Spilsbury K, Rosenwax L, et al. Use of health services in the last year of life and cause of death in people with intellectual disability: a retrospective matched cohort study. BMJ Open 2018; 8: e020268.
- 24. Robertson J, Baines S, Emerson E, Hatton H. Service responses to people with intellectual disabilities and epilepsy: a systematic review. J Appl Res Intellect Disabil 2017; 30: 1–32.
- 25. Salomon S, Trollor J. A scoping review of causes and contributors to deaths of people with disability in Australia. Findings [report for NDIS Quality and Safeguards Commission]. Feb 2020. https://www.ndiscommission.gov.au/document/1881 (viewed Apr 2021).
- 26. Emerson E, Robertson J, Baines S, Hatton H. Vaccine coverage among children with and without intellectual disabilities in the UK: cross sectional study. BMC Public Health 2019; 19: 748.
- 27. Lin JD, Lin PY, Lin LP. Universal hepatitis B vaccination coverage in children and adolescents with intellectual disabilities. Res Dev Disabil 2010; 31: 338–344.
- 28. Yen CF, Hsu SW, Loh CH, et al. Analysis of seasonal influenza vaccine uptake among children and adolescents with an intellectual disability. Res Dev Disabil 2012; 33: 704–710.
- 29. O’Neill J, Newall F, Antolovich G, et al. Vaccination in people with disability: a review. Hum Vaccin Immunother 2020; 16: 7–15.
- 30. Wilson NJ, Lin Z, Villarosa A, George A. Oral health status and reported oral health problems in people with intellectual disability: a literature review. J Intellect Dev Disabil 2019; 44: 292–304.
- 31. Ummer-Christian R, Iacono T, Grills N, et al. Access to dental services for children with intellectual and developmental disabilities: a scoping review. Res Dev Disabil 2018; 74: 1–13.
- 32. Davis SJB. Asthma in intellectual disability: are we managing our patients appropriately? Breathe (Sheff) 2016; 12: 310–317.
Abstract
Objective: To determine rates of potentially preventable hospitalisation of people with intellectual disability in New South Wales, and compare them with those for the NSW population.
Design: Retrospective cohort study.
Setting: Potentially preventable hospitalisations in NSW, as defined by the National Healthcare Agreement progress indicator 18, 1 July 2001 ‒ 30 June 2015.
Participants: Data collected in a retrospective data linkage study of 92 542 people with intellectual disability in NSW; potentially preventable hospitalisations data for NSW published by HealthStats NSW.
Main outcome measures: Age‐adjusted rates of potentially preventable hospitalisation by group (people with intellectual disability, NSW population), medical condition type (acute, chronic, vaccine‐preventable), and medical condition.
Results: The annual age‐standardised rate for people with intellectual disability ranged between 5286 and 6301 per 100 000 persons, and for the NSW population between 1278 and 1511 per 100 000 persons; the rate ratio (RR) ranged between 3.5 (95% CI, 3.3–3.7) in 2014–15 and 4.5 (95% CI, 4.2–4.9) in 2002–03. The difference was greatest for admissions with acute (RR range: 5.3 [95% CI, 4.9–5.7] in 2014–15 to 8.1 [95% CI, 7.4–8.8] in 2002–03) and vaccine‐preventable conditions (RR range: 2.1 [95% CI, 1.6–3.0] in 2007–08 to 3.4 [95% CI, 2.2–5.2] in 2004–05). By specific condition, the highest age‐standardised rate was for admissions with convulsions and epilepsy (all years, 2567 per 100 000 population; v NSW population: RR, 22.2; 95% CI, 21.3–23.1).
Conclusion: Age‐standardised rates of potentially preventable hospitalisation are higher for people with intellectual disability than for the general population. The reasons for these differences should be investigated, and strategies for averting potentially preventable hospitalisation developed.