


The known: The prevailing continuity model of general practitioner care for aged care facility residents has been criticised for causing delays in service provision and increasing the demand on hospital services.
The new: Directly employing general practitioners in aged care residential homes was associated with 50% reductions in the numbers of unplanned hospital transfers and admissions, but also with a 37% increase in the reported number of falls in the homes.
The implications: The appropriate model of care and the role of GPs in residential aged care require further investigation in other facilities. In particular, the economic efficiency of our intervention should be assessed.
Residential aged care costs are a large and rapidly growing component of public expenditure in developed nations.1,2 In Australia, the Royal Australasian College of General Practitioners recommends the continuity model of care, in which general practitioners continue to provide care for their long term patients after they have moved to residential aged care facilities.3,4,5 However, this model has been criticised for causing delays in service provision, and also because responsibility for care is often transferred to hospitals in cases of emergency.5 Further, the position of registered nurses in aged care facilities is poorly defined; some report role confusion, feeling constrained in their roles, or having limited responsibility or opportunities to practise as registered nurses in aged care.6
In this trial, we evaluated the effect of providing an alternative model of care in several aged care facilities across Australia. GPs were directly employed as members of staff in the aged care homes, clinical managers were appointed to work with the GPs, and some tasks previously undertaken by registered nurses were re‐allocated to care assistants, allowing registered nurses greater involvement in the planning of care for residents.
Methods
Design
Our study, initiated by the provider Bupa Aged Care, was a stepped wedge, cluster randomised controlled trial with cohort and cross‐sectional elements.7,8 The trial period was preceded by a 54‐week pre‐trial retrospective data period and followed by a 54‐week post‐trial prospective data collection period. Clusters of residential aged care facilities were randomised to commencing the intervention care model at different times, with one cluster transitioning from the control to the intervention model at the start of each 9‐week time block, with 18‐week wash‐ins for the transition in model of care (Box 1).
The trial was registered with the Australia New Zealand Clinical Trial Registry on 25 February 2013 (ACTRN12613000218796).
Participants and setting
In 2012, Bupa Aged Care selected 15 residential aged care facilities for the trial according to their anticipated ability to implement the trial design and according to their size and geographic proximity (so that attractive GP positions could be advertised). The facilities were divided into seven clusters: cluster 1 (Victoria, metropolitan: three sites), cluster 2 (Queensland, regional: four sites), cluster 3 (Victoria, regional: one site), cluster 4 (New South Wales, metropolitan: three sites), cluster 5 (South Australia, metropolitan: one site), cluster 6 (New South Wales, metropolitan: two sites), and cluster 7 (Victoria, regional: one site).
Control and intervention care models
The organisational structures and reporting lines at the participating residential aged care facilities during the standard model of care (control) and the new model of care (intervention) are depicted in Box 2.
In the control model, residents were seen by external GPs not directly linked with facility staff, facility care managers had predominantly administrative roles, registered nurses undertook medication rounds but provided little direct care other than more complex procedural care (eg, wound dressings), and direct care was largely the responsibility of Certificate III qualified or enrolled nurses.
In the intervention model of care, GPs were members of staff at residential aged care facilities (under the direction of the medical services director of Bupa Aged Care), a clinical manager was appointed to support the GP in managing medical practice, a registered nurse‐in‐charge was designated, and a registered nurse or endorsed enrolled nurse was selected as team leader for a small group of personal care attendants responsible for a “community” of residents. Personal care attendants were trained, using the Medication Assistance Skill Set training package9 for their new role, assisting aged care residents with their medications.
Facility GPs were permitted to operate their practices as independent clinicians; the provider organisation consulted with the Aged Care Guild and the Australian Medical Association about the structure of their role. One full‐time GP was employed for each 150 residents at a facility, but it was anticipated that some homes would share GPs because of size and geographic proximity. GPs were recruited through recruitment agencies and mainstream media advertising (web and print) and employed as salaried staff by Bupa Aged Care. Medicare‐based fees were charged for service items, but this revenue was returned to Bupa Aged Care.
Procedure
Clusters of sites were randomised to starting positions in the trial by one author (TPH) using a computer‐generated number command in Microsoft Excel based on codes for each participating facility; at the time of sequence generation, TPH was not aware of which facility was represented by which code letter. Facility staff, residents, and investigators were not blinded to the allocation sequence after it was generated. Training of staff at the initial intervention sites and recruiting of GPs commenced on 4 March 2013; data for the intervention period was collected from 8 July 2013. The trial period concluded on 21 September 2014, and the prospective follow‐up concluded on 4 October 2015.
Primary outcome measures
As primary outcomes we selected three indicators of patient care quality important for aged care home residents, service provision, and the health system:10 numbers of falls,11 unplanned hospital transfers,12 and polypharmacy.13,14,15 Data on polypharmacy were provided to Bupa Aged Care by third party pharmaceuticals providers; only residents who obtained their medications from these providers were included in this analysis. Polypharmacy was defined as a patient being prescribed six or more medications at the start of a time block. Data on unplanned transfers to emergency departments were obtained from the electronic resident tracking system (resident movement summary), incident reports in the provider's electronic record system (Amity Management System), and handwritten resident progress notes reviewed by facility staff members. Falls were identified in the Bupa Aged Care incident reporting system.
Secondary outcomes
Secondary outcomes were out‐of‐hours requests for GPs (in‐house or external), new urinary tract, respiratory and gastrointestinal infections, new skin tears, new pressure injuries, fractures arising from falls, unplanned hospital admissions, complaints by residents and family members, reports of resident aggression, deaths of residents, and medication errors.
Staff satisfaction was measured in an annual survey administered to all facility staff that included the question, “Overall, I am extremely satisfied with (site service provider name) as a place to work” (5‐point Likert response scale). Staff turnover was defined as the proportion of staff who resigned during each time block.
Whether a GP was employed at the facility during each intervention period was a binary variable (a GP was or was not present for at least half of the nine‐week block). The proportion of residents who transferred their care to the provider‐employed GP was audited during blocks 4, 5 and 6 (Box 1).
Statistical analysis
We analysed summative, site‐level data for each time block of the trial. The primary analysis was an intention‐to‐treat analysis of data from the stepped wedge component of the trial; the secondary analysis also included the retrospective and follow‐up data periods. Data from the control and intervention periods were assessed in multi‐level, mixed effects, generalised linear models (Stata MP 14.0). Each analysis treated facilities in a cluster as random effects and adjusted for the trial block as a categorical variable.7 Dependent variables with count outcomes were adjusted for the number of resident‐occupied bed‐days at the facility in each nine‐week block, and modelled as a Poisson distribution with log‐link function. Outcomes expressed as proportions across facilities during each block were modelled as Gaussian distributions with identity link functions, allowing estimation of absolute risk reduction. Absolute rate reductions were also calculated for dependent variables with count outcomes in the primary analyses.
Post hoc tertiary contamination‐adjusted intention‐to‐treat analyses16 isolated the effect of employing GPs at facilities (details: online Supporting Information). Staff satisfaction in 2012 and 2015 was compared using ordered logit regression with robust standard error estimation and data clustered by site.
Sample size calculation
To achieve greater than 80% power for detecting a 27% reduction in unplanned hospital transfers per time block (from 12.4 to 9.05 transfers per facility per time block), 15 facilities distributed across seven clusters, with one cluster transitioning from control to intervention per block of time, were adequate (α = 0.05 [two‐tailed]; assumed intra‐class correlation coefficient, 0.71, based on data provide by Bupa Aged Care).
Ethics approval
Ethics approval was granted on 12 February 2013 by the University of Tasmania Human Research Ethics Committee (reference, H0012892). A waiver of the requirement for individual resident consent for data collection was granted.
Results
All 15 facilities nominated by Bupa Aged Care participated in the trial and provided data for analysis. The general characteristics of residents at the end of the pre‐trial retrospective data period (block 1) are summarised in Box 3; deviations from the protocol in the course of the study are summarised in the online Supporting Information. The intervention model of care was implemented at each site as scheduled, but four of the 15 sites (including three in regional cities) were unable to recruit a GP to work at their facility at any time during the stepped wedge trial and the prospective follow‐up periods (Box 1). A GP was present for at least five weeks in 91 of the 148 9‐week site blocks during the intervention and prospective follow‐up periods.
The audit of transfer of resident care responsibility to provider‐employed GPs during blocks 4–6 identified that cluster 1 sites (facilities 1, 2, 3) respectively had peak uptake rates of 88% (98 of 111 residents), 30% (30 of 101) and 71% (78 of 110), while two of the cluster 2 sites (facilities 4, 5) had peak uptake rates of 60% (32 of 53) and 67% (82 of 123). Two of the cluster 4 sites (facilities 9, 10, 11) had peak uptake rates of 18% (8 of 45) and 50% (21 of 42), although the intervention had only just commenced in this cluster when the audit ended; the audit was not undertaken in one cluster 4 facility.
Primary and secondary analyses
The intervention had no significant impact on the primary outcomes of numbers of falls, unplanned hospital transfers (Box 4), and polypharmacy (Box 5). The number of hospital admissions was lower during the intervention than the control period in both the primary (incidence rate ratio [IRR], 0.74; 95% confidence interval [CI], 0.56–0.96) and secondary analyses (IRR, 0.78; 95% CI, 0.62–0.98).
The rates of infection were higher during the intervention (IRR, 1.35; 95% CI, 1.14–1.59), particularly urinary tract infections (IRR, 1.34; 95% CI, 1.06–1.69). The medication error rate was significantly higher during the intervention (primary analysis: IRR, 5.11; 95% CI, 2.66–9.81; secondary analysis: IRR, 3.63; 95% CI, 2.06–6.38), but only one medication error during the study was classified as “serious”. In the secondary (but not the primary) analysis, the mortality rate was higher during the intervention period (IRR, 1.39; 95% CI, 1.03–1.88) (Box 4). The numbers of deaths were the same for both models, but as raw figures can be misleading in a stepped wedge design study, the difference in effect sizes is a more appropriate indicator.8 The proportion of residents prescribed “as required” medications was 7 percentage points (95% CI, 5–9 percentage points) lower in the primary analysis (10 percentage points [95% CI, 8–11 percentage points] lower in the secondary analysis), and the proportion prescribed psychotropic medications was 2 percentage points (95% CI, 1–3 percentage points) lower in the secondary analysis (Box 5).
Contamination‐adjusted intention‐to‐treat analyses
The number of unplanned hospital transfers was about 50% lower when facility GPs were present (IRR, 0.53; 95% CI, 0.43–0.66); the number of hospital admissions (IRR, 0.52; 95% CI, 0.41–0.64), length of stay in hospital (IRR, 0.44; 95% CI, 0.30–0.63), and number of out‐of‐hours GP calls (IRR, 0.54; 95% CI, 0.36–0.80) were also lower. The rate of falls was higher (IRR, 1.37; 95% CI, 1.20–1.58) (Box 4). The proportion of residents prescribed “as required” medications was 18 percentage points lower (95%, 15–21 percentage points) when GPs were present (Box 5).
Facility staff satisfaction
Fifteen hundred responses to the staff survey were received in 2012 and 1409 in 2015. Most staff members either strongly agreed (2012: 29%, 2015: 27%) or agreed (2012: 48%, 2015: 42%) that they were extremely satisfied with their facility as a place of work. The difference in satisfaction between these years was not significant (ordered logit regression coefficient, –0.25; robust 95% CI, –0.64 to 0.13; P = 0.20).
Discussion
Our findings suggest that residential aged care facilities directly employing GPs might substantially benefit both residents and local health care services. Our contamination‐adjusted intention‐to‐treat analyses of the impact of in‐house GPs identified reductions of about 50% in the numbers of unplanned transfers and admissions of residents to hospitals, days in hospital for unplanned admissions, out‐of‐hours GP call‐outs, and complaints by residents and their families, as well as reduced prescribing of “as required” medications. However, these positive changes were accompanied by a significant rise in the number of falls reported; further, the overall intention‐to‐treat analyses identified that increased rates of infection and medication error were associated with the intervention. The nursing component of the intervention model of care, designed to support the introduction of in‐house GPs, could be implemented in all facilities. This component may have contributed to changes in the reported infection rates, as a significant intervention effect was measured in the primary and secondary analyses, but not in the contamination‐adjusted intention‐to‐treat analyses.
Deriving clear recommendations for policymakers from our findings is complicated by the discordant findings for some outcomes. For example, the rate of unplanned hospitalisation was lower during the intervention despite increased rates of reported falls, infections, and medication errors. It is conceivable that unwell residents who were more likely to fall were retained in their care facility during the intervention period, whereas during the control period they would have been transferred to an acute hospital. Another explanation may lie in how each data element was detected, recorded, and collated. Under‐reporting of adverse events has been documented in a range of care settings.17,18 The change in model of care, with its greater emphasis on care planning and increased availability of GPs who could order tests, may have increased the detection of infections. Increased vigilance in recording falls and infections may also have been a factor. Further, the registered nurses responsible for recording medication errors were also responsible for delivering medications during the control phase, but not during the intervention. Removing the medication dispensing role from this group may have led to a form of resentment bias,19 increasing the likelihood that minor medication errors would be reported during the intervention period compared with the control period.
Limitations
Our study was limited in its ability to generate a resident‐level dataset for analysis. We relied on routinely collected data for all outcomes rather than collecting them de novo, as the stepped wedge design imposes a considerable data collection burden with its requirement to capture data during each time period of the investigation.20 Our reliance on third parties for medications data and the migration of the Bupa Aged Care database to a new platform during our study contributed to the risk of missing relevant data, which would have affected our analyses of polypharmacy more than the other outcomes.
Conclusion
The appropriate model of care and the role of GPs in residential aged care each require further investigation in other facilities. In particular, the economic efficiency of our intervention should be assessed. Such research would be facilitated by developing a common outcomes dataset and data repository for aged care facilities in Australia.
Availability of data and materials:
The complete facility‐level dataset and statistical code are available from the corresponding author.
Box 1 – Schedule for the stepped wedge cluster randomised trial, including retrospective pre‐trial data and prospective follow‐up periods
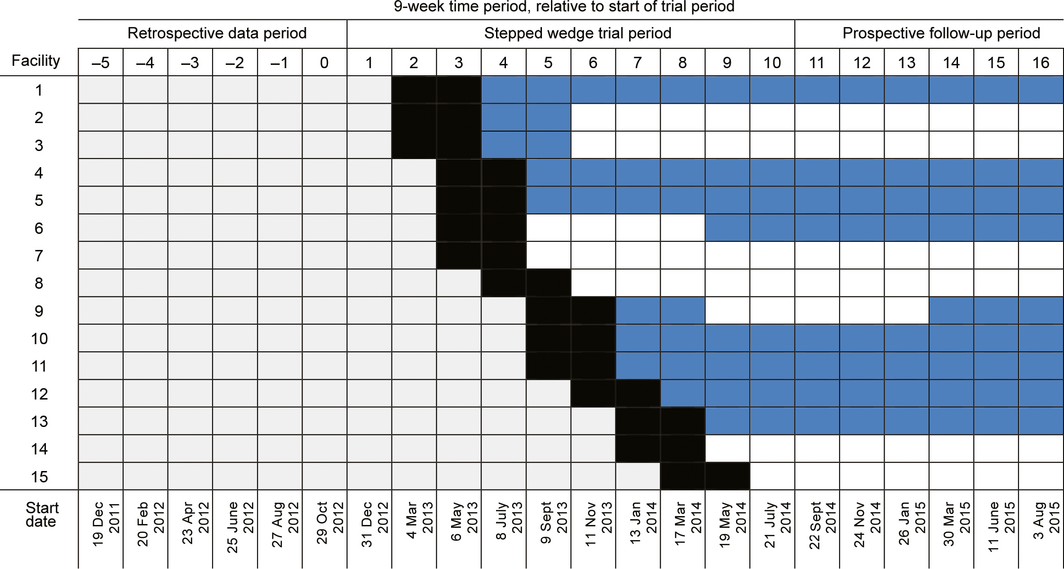
Grey periods: old model of care; black periods: wash‐in period at start of implementation of the intervention care model; blue periods: new model of care, with general practitioner employed for at least half of the period; white periods: new model of care, but no general practitioner employed for at least half of period.
Box 2 – Reporting relationships between medical staff members, care managers, clinical managers, facility general managers, and care staff during control (A) and intervention periods (B)
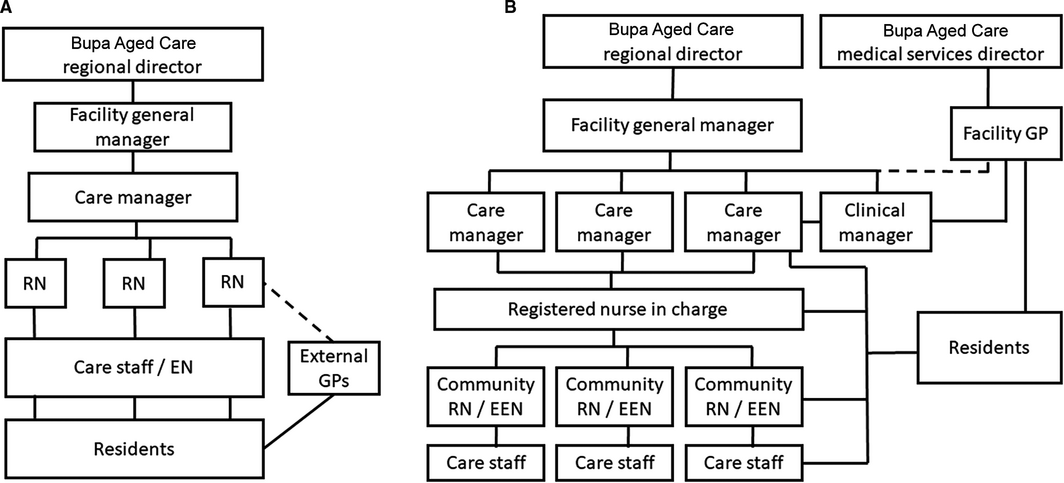
EEN = endorsed enrolled nurse; EN = enrolled nurse; GP = general practitioner; RN = registered nurse.
Box 3 – Facility characterstics at end of the retrospective data pre‐trial period, with respect to primary and secondary outcomes
|
Characteristic |
Mean (SD) or number (proportion) |
||||||||||||||
|
|
|||||||||||||||
|
Number of beds, per facility |
98 (31) |
||||||||||||||
|
Primary outcomes‐related |
|
||||||||||||||
|
Falls, per facility per 9‐week block |
50 (24) |
||||||||||||||
|
Fall‐related fractures, per facility per 9‐week block |
0.3 (0.7) |
||||||||||||||
|
Unplanned hospital transfers, per facility per 9‐week block |
18 (7) |
||||||||||||||
|
Unplanned hospital admissions, per facility per 9‐week block |
12 (5) |
||||||||||||||
|
Days in hospital (unplanned admissions), per facility per 9‐week block |
96 (56) |
||||||||||||||
|
Polypharmacy, proportion of residents per site |
73% (11%) |
||||||||||||||
|
Number of medications, per resident per site |
8 (1) |
||||||||||||||
|
Residents prescribed psychotropics, proportion per site |
69% (10%) |
||||||||||||||
|
Residents prescribed “as required” medications, proportion per site |
78% (13%) |
||||||||||||||
|
Residents prescribed antibiotics, proportion per site |
3% (3%) |
||||||||||||||
|
Secondary outcomes‐related |
|
||||||||||||||
|
Out‐of‐hours GP call‐outs, per facility per 9‐week block |
14 (15) |
||||||||||||||
|
New infections, per facility per 9‐week block |
18 (9) |
||||||||||||||
|
Urinary tract infections, per facility per 9‐week block |
10 (5) |
||||||||||||||
|
Gastrointestinal infections, per facility per 9‐week block |
0 (0) |
||||||||||||||
|
Respiratory infections, per facility per 9‐week block |
8 (6) |
||||||||||||||
|
New pressure areas, per facility per 9‐week block |
4 (3) |
||||||||||||||
|
Skin tears, per facility per 9‐week block |
24 (16) |
||||||||||||||
|
Complaints by residents/families, per facility per 9‐week block |
10 (7) |
||||||||||||||
|
Episodes of resident aggression, per facility per 9‐week block |
3 (3) |
||||||||||||||
|
Resident deaths, per facility per 9‐week block |
7 (2) |
||||||||||||||
|
Medication errors, per facility per 9‐week block |
2 (3) |
||||||||||||||
|
Staff who resigned, proportion per site |
7% (3%) |
||||||||||||||
|
|
|||||||||||||||
|
SD = standard deviation. * Data for residents who obtained their medications from third party suppliers of medications to 14 of the 15 aged care facilities. |
|||||||||||||||
Box 4 – Primary, secondary, and contamination‐adjusted intention‐to‐treat analyses of outcomes, compared as incidence rate ratios
|
Outcome |
Mean number (SD), per site per nine‐week block |
Primary analysis |
Secondary analysis |
Contamination‐adjusted intention‐to‐treat analysis |
|||||||||||
|
Stepped wedge trial period |
Entire study |
||||||||||||||
|
Control |
Intervention |
Control |
Intervention |
IRR |
P |
IRR |
P |
IRR |
P |
||||||
|
|
|||||||||||||||
|
Occupied bed‐days |
6610 (2219) |
6255 (1800) |
6201 (2141) |
6347 (1906) |
— |
— |
— |
— |
— |
— |
|||||
|
Primary and related outcomes |
|||||||||||||||
|
Falls |
56 (25) |
59 (25) |
45 (24) |
55 (24) |
1.05 (0.94–1.18) |
0.35 |
1.03 (0.94–1.14) |
0.50 |
1.37 (1.20–1.58) |
< 0.001 |
|||||
|
Fall‐related fractures |
1 (1) |
1 (1) |
0 (1) |
1 (1) |
1.54 (0.56–4.22) |
0.40 |
1.63 (0.68–3.89) |
0.27 |
NC |
|
|||||
|
Unplanned hospital transfers |
19 (10) |
14 (9) |
17 (9) |
13 (9) |
0.81 (0.66–1.01) |
0.06 |
0.87 (0.72–1.04) |
0.12 |
0.53 (0.43–0.66) |
< 0.001 |
|||||
|
Unplanned hospital admissions |
13 (7) |
9 (6) |
12 (7) |
8 (6) |
0.74 (0.56–0.96) |
0.024 |
0.78 (0.62–0.98) |
0.035 |
0.52 (0.41–0.64) |
< 0.001 |
|||||
|
Days in hospital |
99 (66) |
62 (51) |
86 (58) |
60 (51) |
0.87 (0.79–0.97) |
0.007 |
0.89 (0.81–0.97) |
0.007 |
0.44 (0.30–0.63) |
< 0.001 |
|||||
|
Secondary outcomes |
|||||||||||||||
|
Out‐of‐hours GP call‐outs |
16 (16) |
15 (16) |
16 (18) |
13 (15) |
0.84 (0.42–1.68) |
0.61 |
1.02 (0.53–1.95) |
0.96 |
0.54 (0.36–0.80) |
0.002 |
|||||
|
Infections |
20 (11) |
25 (16) |
18 (12) |
23 (17) |
1.42 (1.18–1.70) |
< 0.001 |
1.35 (1.14–1.59) |
< 0.001 |
1.22 (0.95–1.58) |
0.11 |
|||||
|
Urinary tract |
10 (5) |
11 (8) |
8 (5) |
10 (7) |
1.68 (1.29–2.20) |
< 0.001 |
1.34 (1.06–1.69) |
0.015 |
1.26 (0.97–1.62) |
0.08 |
|||||
|
Gastrointestinal |
1 (4) |
2 (6) |
2 (7) |
2 (7) |
NC |
|
|
|
NC |
|
|||||
|
Respiratory |
9 (7) |
12 (11) |
9 (7) |
11 (10) |
1.23 (0.94–1.62) |
0.12 |
1.27 (1.00–1.61) |
0.047 |
1.17 (0.87–1.59) |
0.31 |
|||||
|
Pressure areas |
4 (4) |
4 (3) |
3 (3) |
4 (4) |
1.11 (0.71–1.74) |
0.64 |
1.30 (0.90–1.88) |
0.16 |
0.88 (0.65–1.19) |
0.40 |
|||||
|
Skin tears |
29 (17) |
31 (23) |
21 (15) |
28 (19) |
0.95 (0.81–1.10) |
0.48 |
0.88 (0.77–1.01) |
0.06 |
NC |
|
|||||
|
Patient/family complaints |
10 (9) |
9 (11) |
9 (8) |
8 (9) |
0.87 (0.42–1.76) |
0.69 |
0.67 (0.36–1.25) |
0.21 |
0.46 (0.33–0.63) |
< 0.001 |
|||||
|
Episodes of resident aggression |
3 (3) |
3 (2) |
3 (3) |
3 (2) |
1.02 (0.65–1.59) |
0.93 |
0.89 (0.61–1.31) |
0.56 |
NC |
|
|||||
|
Deaths |
6 (3) |
6 (3) |
6 (3) |
6 (3) |
1.31 (0.94–1.82) |
0.12 |
1.39 (1.03–1.88) |
0.030 |
NC |
|
|||||
|
Medication errors |
5 (5) |
13 (12) |
3 (4) |
12 (10) |
5.11 (2.66–9.81) |
< 0.001 |
3.63 (2.06–6.38) |
< 0.001 |
NC |
|
|||||
|
|
|||||||||||||||
|
CI = confidence interval; IRR = incidence rate ratio; NC = not calculated: auxiliary ordinary least squares regression: P < 0.80 (see Supporting Information, table 1); SD = standard deviation. Adjusted for resident bed‐days per site per month. For absolute rate reductions, see online Supporting Information, table 1. Data missing from the first five retrospective study blocks (no reliable data collection during this period). |
|||||||||||||||
Box 5 – Primary, secondary and tertiary analyses for outcomes, compared as differences in proportion or mean (absolute risk reduction)
|
Outcome |
Mean proportion* or number (SD) |
Primary analysis |
Secondary analysis |
Contamination‐adjusted intention‐to‐treat analysis |
|||||||||||
|
Stepped wedge trial period |
Entire study |
||||||||||||||
|
Control |
Intervention |
Control |
Intervention |
ARR |
P |
ARR |
P |
ARR |
P |
||||||
|
|
|||||||||||||||
|
Primary outcome |
|||||||||||||||
|
Polypharmacy |
76% (9%) |
73% (7%) |
76% (10%) |
74% (8%) |
0 (–2 to 2) |
0.89 |
–1 (–3 to 1) |
0.36 |
NC |
|
|||||
|
Secondary outcomes |
|||||||||||||||
|
Medications per resident |
9 (1) |
8 (1) |
8 (1) |
8 (1) |
–0.09 (–0.29 to 0.11) |
0.37 |
–0.12 (–0.28 to 0.05) |
0.16 |
NC |
|
|||||
|
Medications prescribed: |
|||||||||||||||
|
Psychotropics |
66% (12%) |
71% (8%) |
69% (13%) |
69% (9%) |
–1 (–2 to 1) |
0.37 |
–2 (–3 to –1) |
0.001 |
NC |
|
|||||
|
“As required” medications |
71% (17%) |
69% (9%) |
75% (19%) |
68% (11%) |
–7 (–9 to –5) |
< 0.001 |
–10 (–11 to –8) |
< 0.001 |
–18 (–21 to –15) |
< 0.001 |
|||||
|
Antibiotics |
5% (4%) |
3% (2%) |
4% (3%) |
4% (3%) |
–0 (–1 to 0) |
0.76 |
0 (–1 to 1) |
0.87 |
0 (–1 to 1) |
0.76 |
|||||
|
Staff members leaving per time block |
8% (3%) |
8% (8%) |
7% (3%) |
7% (6%) |
1 (–2 to 3) |
0.62 |
0 (–1 to 2) |
0.73 |
1 (–1 to 3) |
0.42 |
|||||
|
|
|||||||||||||||
|
ARR = absolute rate reduction (change in proportions associated with intervention, in percentage points, except “Medications per resident”: absolute numbers); IRR = incidence rate ratio; NA = not applicable; NC = not calculated: auxiliary ordinary least squares regression: P < 0.80 (see Supporting Information, table 2); SD = standard deviation.For absolute numbers of assessments, see Supporting Information, table 2.Proportion of resident assessments. These analyses exclude all data from two sites, and retrospective period data for another two sites. Data monitoring of third party provider pharmacy data at these sites identified inconsistencies during the study period; for one, the inconsistencies could not be resolved, while for two the inconsistencies could be resolved from the commencement of the prospective data collection period. |
|||||||||||||||
Received 14 June 2019, accepted 13 November 2019
- Terry P Haines1
- Andrew J Palmer2,3
- Petra Tierney4
- Lei Si2
- Andrew L Robinson3
- 1 Monash University, Melbourne, VIC
- 2 Menzies Institute for Medical Research, University of Tasmania, Hobart, TAS
- 3 Wicking Dementia Research and Education Centre, University of Tasmania, Hobart, TAS
- 4 Bupa Aged Care Australia, Sydney, NSW
Terry Haines was supported by a National Health and Medical Research Council Career Development Fellowship.
This study was funded by the Bupa Health Foundation, and the trial was conducted at Bupa Aged Care facilities. The Bupa Health Foundation had no role in the study design, data collection, analysis or interpretation, reporting or publication. There were no financial relationships with any organisations with an interest in the research question during the preceding three years. Petra Tierney was employed by Bupa Aged Care during the trial but not during manuscript preparation. A copy of the project report was submitted to the Bupa Health Foundation before submitting the manuscript to the MJA.
- 1. Appleby J. Spending on health and social care over the next 50 years: why think long term? London: The King's Fund, 2013. https://www.kingsfund.org.uk/publications/spending-health-and-social-care-over-next-50-years (viewed Jan 2020).
- 2. de la Maisonneuve C, Martins JO. Public spending on health and long‐term care: a new set of projections (OECD Policy Papers, no. 6). Paris: OECD Publishing, 2013. https://www.oecd.org/eco/growth/Health%20FINAL.pdf (viewed Jan 2020).
- 3. Reed RL. Models of general practitioner services in residential aged care facilities. Aust Fam Physician 2015; 44: 176–179.
- 4. Shield R, Rosenthal M, Wetle T, et al. Medical staff involvement in nursing homes: development of a conceptual model and research agenda. J Appl Gerontol 2014; 33: 75–96.
- 5. Swannell C. Aged care “broken”. MJA Insight [online], 7 Apr 2014. https://insightplus.mja.com.au/2014/12/aged-care-broken (viewed Jan 2020).
- 6. Fussell B, McInerney F, Patterson E. Experiences of graduate registered nurses in aged care: a case study. Contemp Nurse 2009; 33: 210–223.
- 7. Hemming K, Haines TP, Chilton PJ, et al. The stepped wedge cluster randomised trial: rationale, design, analysis, and reporting. BMJ 2015; 350: h391.
- 8. Haines TP, Hemming K. Stepped‐wedge cluster‐randomised trials: level of evidence, feasibility and reporting. J Physiother 2018; 64: 63–66.
- 9. Australian Government. CHCSS00035. Medication Assistance Skill Set (CHC Community Services Training Package) [now superseded by CHC Community Services Training Package CHCSS00070]. www.training.gov.au/Training/Details/CHCSS00070 (viewed Mar 2020).
- 10. Craig P, Dieppe P, Macintyre S, et al; Medical Research Council Guidance. Developing and evaluating complex interventions: the new Medical Research Council guidance. BMJ 2008; 337: a1655.
- 11. Rapp K, Becker C, Cameron ID, et al. Epidemiology of falls in residential aged care: analysis of more than 70 000 falls from residents of Bavarian nursing homes. J Am Med Dir Assoc 2012; 13: 187.e1–6.
- 12. Arendts G, Reibel T, Codde J, Frankel J. Can transfers from residential aged care facilities to the Emergency Department be avoided through improved primary care services? Data from qualitative interviews. Aust J Ageing 2010; 29: 61–65.
- 13. Nguyen JK, Fouts MM, Kotabe SE, Lo E. Polypharmacy as a risk factor for adverse drug reactions in geriatric nursing home residents. Am J Geriatr Pharmacother 2006; 4: 36–41.
- 14. Baranzini F, Diurni M, Ceccon F, et al. Fall‐related injuries in a nursing home setting: is polypharmacy a risk factor? BMC Health Serv Res 2009; 9: 228.
- 15. Onder G, Liperoti R, Fialova D, et al; SHELTER Project. Polypharmacy in nursing home in Europe: results from the SHELTER study. J Gerontol A Biol Sci Med Sci 2012; 67: 698–704.
- 16. Sussman JB, Hayward RA. An IV for the RCT: using instrumental variables to adjust for treatment contamination in randomised controlled trials. BMJ 2010; 340: c2073.
- 17. Sarkies MN, Bowles KA, Skinner EH, et al. Do daily ward interviews improve measurement of hospital quality and safety indicators? A prospective observational study. J Eval Clin Pract 2016; 22: 792–798.
- 18. Snyder LA, Chen PY, Vacha‐Haase T. The underreporting gap in aggressive incidents from geriatric patients against certified nursing assistants. Violence Vict 2007; 22: 367–379.
- 19. McMillan JH. Randomized field trials and internal validity: not so fast my friend. Practical Assess Res Eval 2007; 12: 15.
- 20. Kotz D, Spigt M, Arts IC, et al. Use of the stepped wedge design cannot be recommended: a critical appraisal and comparison with the classic cluster randomized controlled trial design. J Clin Epidemiol 2012; 65: 1249–1252.
Abstract
Objectives: To evaluate whether an alternative model of care in aged care facilities, including in‐house general practitioners, influenced health outcomes for residents.
Design: Stepped wedge, cluster randomised controlled trial over 90 weeks (31 December 2012 – 21 September 2014), with a 54‐week pre‐trial retrospective data period (start: 19 December 2011) and a 54‐week post‐trial prospective data collection period (to 4 October 2015).
Participants, setting: Fifteen residential aged care facilities operated by Bupa Aged Care in metropolitan and regional cities in four Australian states.
Intervention: Residential aged care facilities sought to recruit general practitioners as staff members; care staff roles were redefined to allow registered nurses greater involvement in care plan development.
Main (primary) outcome measures: Numbers of falls; numbers of unplanned transfers to hospital; polypharmacy.
Results: The new model of care could be implemented in all facilities, but four could not recruit in‐house GPs at any time during the trial period. Intention‐to‐treat analyses found no statistically significant effect of the intervention on the primary outcome measures. Contamination‐adjusted intention‐to‐treat analyses identified that the presence of an in‐house GP was associated with reductions in the numbers of unplanned hospital transfers (incidence rate ratio [IRR], 0.53; 95% CI, 0.43–0.66) and admissions (IRR, 0.52; 95% CI, 0.41–0.64) and of out‐of‐hours GP call‐outs (IRR, 0.54; 95% CI, 0.36–0.80), but also with an increase in the number of reported falls (IRR, 1.37; 95% CI, 1.20–1.58).
Conclusions: Recruiting GPs to work directly in residential aged care facilities is difficult, but may reduce the burden of unplanned presentations to hospitals and increase the reporting of adverse events.
Trial registration: Australia New Zealand Clinical Trial Registry, ACTRN12613000218796 (25 February 2013).