


The known: Many patients treated in hospital for trauma later undergo inpatient rehabilitation, but whether this improves outcomes, compared with discharge home, is unknown.
The new: Our large observational study of adult inpatients treated for isolated lower limb fractures, based on propensity score analysis of registry data, found that inpatient rehabilitation was associated with poorer outcomes than direct discharge home. However, residual covariate imbalances between the discharge groups remained.
The implications: The impact of discharge destination on outcomes after treatment for orthopaedic trauma requires further investigation, particularly the factors that remained unbalanced in our study after propensity score adjustment (funding source, site and cause of injury).
After treatment in hospital for trauma, patients often enter inpatient rehabilitation (IPR) to prepare for their return home and to community living;1 as many as 39% of patients treated for trauma without brain injury are discharged to IPR.2 Home‐based or outpatient rehabilitation are less expensive options for patients with isolated injuries who are physically able to return home.3 The outcomes of home‐based rehabilitation following elective orthopaedic surgery are comparable with those of IPR; for example, functional outcomes following total knee replacements were similar in a recent randomised controlled trial (RCT).4 Analogous trials including patients treated for orthopaedic trauma have not been reported.
The gold standard approach for outcomes research is the RCT, as such trials reduce selection bias and confounding by uncontrolled factors. However, RCTs are expensive and complicated by recruitment difficulties and may lack equipoise when a particular treatment is well established in clinical practice.5 High quality analysis of clinical registry data is an alternative approach that has the advantage of large patient datasets, often encompassing multiple outcomes recorded at several time points, although results must be interpreted with care in the absence of random allocation to treatment and the potential for confounding.6
Propensity scoring in observational research can improve the balance of baseline covariates between the two groups (exposed and unexposed) by fitting a regression model to predict the exposure variable, and using the estimated probabilities of exposure (propensity) to adjust for imbalances in confounding variables.7 Propensity score models are increasingly used in trauma research, but the type of propensity score analysis and whether the exposure groups are balanced with respect to confounders are not always adequately reported.7
The aim of our study was to examine the association between discharge destination (IPR, home) and patient‐reported outcomes at 12 months for adults of working age treated in hospital for isolated lower limb fractures.
Methods
We analysed data from the Victorian Orthopaedic Trauma Outcomes Registry (VOTOR), a sentinel site registry established in 2003 to collect data on all orthopaedic trauma admissions to four hospitals in Victoria (two adult major trauma service hospitals, a regional trauma service, and a metropolitan trauma service.).8
Patients aged 18–64 years were included if they were admitted to one of the participating hospitals between 1 March 2007 and 31 March 2016 with an isolated lower limb fracture, survived to hospital discharge, and were discharged directly home or to IPR.
We analysed data for working age adults because return to work was deemed an important outcome; further, being older than 64 years may influence the need for IPR, as well as return to work and functional outcomes. We extracted patient information on age, sex, socio‐economic status of residential postcode (Index of Relative Socioeconomic Advantage and Disadvantage [IRSAD], derived from the 2006 Australian census9), pre‐injury employment status, self‐reported pre‐injury disability status, and pre‐existing health conditions (Charlson Comorbidity Index10). Occupation, highest level of education, location of residence (rural, metropolitan), site of fracture, cause of injury, compensation or insurance status, and whether the patient was admitted to an intensive care unit (ICU) were also assessed. Information on mental health conditions was based on International Statistical Classification of Diseases and Related Health Problems, 10th revision, Australian modification (ICD‐10‐AM) diagnosis codes reported for each admission.
Outcomes data were collected in telephone interviews by trained registry staff 12 months after the patient's injury. Outcomes of interest were:
- the extended Glasgow Outcome Scale (GOS‐E) score, which rates function on a scale from 1 (death) to 8 (upper good recovery), based upon self‐care, mobility, work, relationships, and social and leisure activities;11 and
- return to work (for those working prior to their injury), which reflects the financial and social burden of trauma and is a measure of post‐injury function.
Data analysis
Five age range categories (18–24, 25–34, 35–44, 45–54, 55–64 years) and IRSAD deciles of socio‐economic disadvantage (residential address at time of injury) were applied. The compensation or insurance status categories were Medicare, compensable, and private health insurance. The Transport Accident Commission and WorkSafe Victoria are the respective third party insurers for road‐ and work‐related injuries in Victoria; patients covered by these schemes were deemed compensable. Medicare is the Australian universal health care system, providing access to medical services, including free public hospital treatment.12
Propensity scores were estimated from the fitted values of a logistic regression model for discharge destination that included all covariates associated with either discharge destination or the return to work and GOS‐E outcomes.7,13 Analyses were restricted to patients with propensity scores within the range common to both discharge destinations to ensure that the positivity assumption and the common support condition were each satisfied;14 that is, the probabilities of discharge home or to IPR were positive for all included patients.
GOS‐E scores were analysed by ordinal logistic regression, and return to work by logistic regression. We applied the inverse probability of treatment weighting (IPTW) method of propensity score analysis,13,15 and the covariate balance between patients discharged home and to IPR was assessed as the absolute value of percentage standardised differences. In IPTW, patients discharged to IPR were assigned a probability weight of 1/propensity score and patients discharged home a weight of 1/(1 – propensity score). Odds ratios (ORs) and 95% confidence intervals (CIs) were then determined by weighted regression, with discharge destination the only covariate. Regression was repeated after adjusting for covariates still unbalanced after weighting. Standardised differences were determined by deriving weighted means of the covariates in the home and IPR groups, and dividing the difference by the pooled standard deviation. Missing data were imputed, as described in the online Supporting Information.
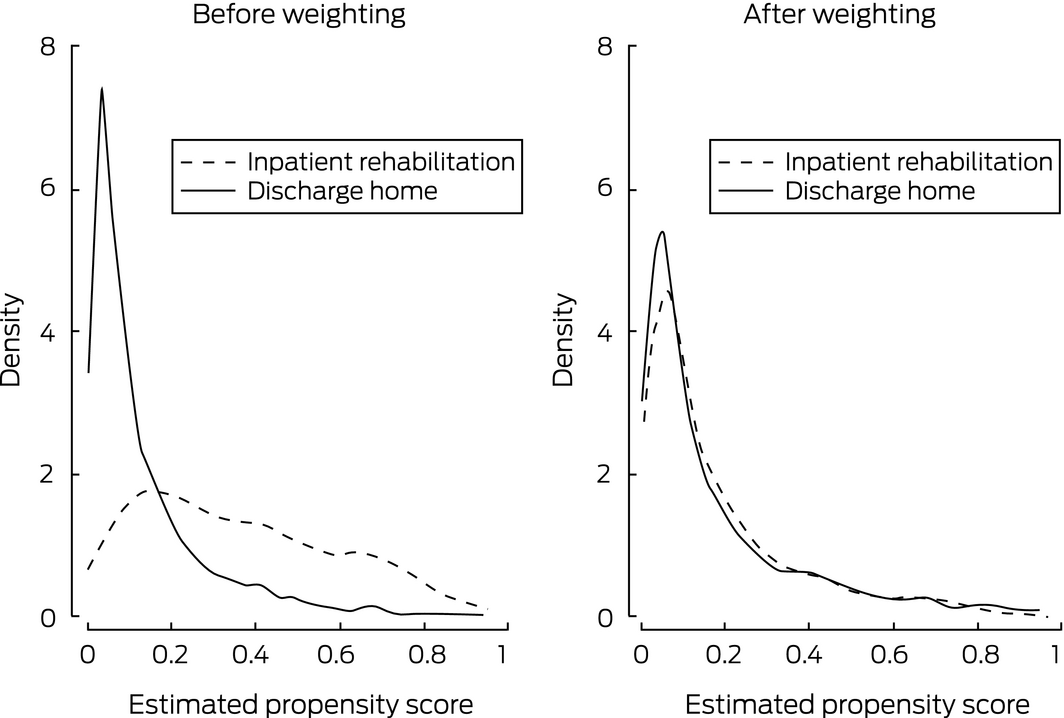
Standardised differences deemed to indicate imbalance in covariates range between 10%13 and 25%.16 We graphically compared propensity score distributions by discharge destination, both before and after weighting, to determine whether they were similar or the curves diverged in specific sections.
Traditional logistic regression analyses were also undertaken in order to review the difference between ORs derived with these methods and the IPTW propensity score analysis.
Sensitivity analyses
A key assumption of propensity score methods — that all variables which influence the outcome or exposure are measured and correctly included in models — is rarely valid. We assessed the sensitivity of our estimates to violation of this assumption by specifying a confounding function that describes the impact of all unmeasured confounding.17 With no unmeasured confounding, the value of the function is one; the more the confounding function deviates from unity, the greater the proportion of the observed difference in outcome that may be attributable to unmeasured confounding. For return to work, we applied confounding functions ranging between 0.7 and 1.2; values less than one encode unmeasured confounding that leads to patients discharged to IPR being less likely to return to work than those discharged home (eg, they were perhaps frailer in unmeasured ways); values greater than one encode unmeasured confounding that leads to participants discharged to IPR being more likely to return to work than those discharged home. The difference between discharge destination groups is not statistically significant at a given confounding function level if the 95% CI of the odds ratio includes unity.
Further sensitivity analyses included interaction terms between discharge destination and compensation status or injury type in the final propensity model.
All analyses were performed in Stata 15.
Ethics approval
The VOTOR operates under Victorian State Trauma Registry ethics approval by the Department of Health and Human Services Human Research Ethics Committee (reference, 11‐14: Monitoring and evaluating the Victorian state trauma registry). The study was exempted from further ethics approval by the Monash University Human Research Ethics Committee (reference, CF12/3270–2012001798).
Results
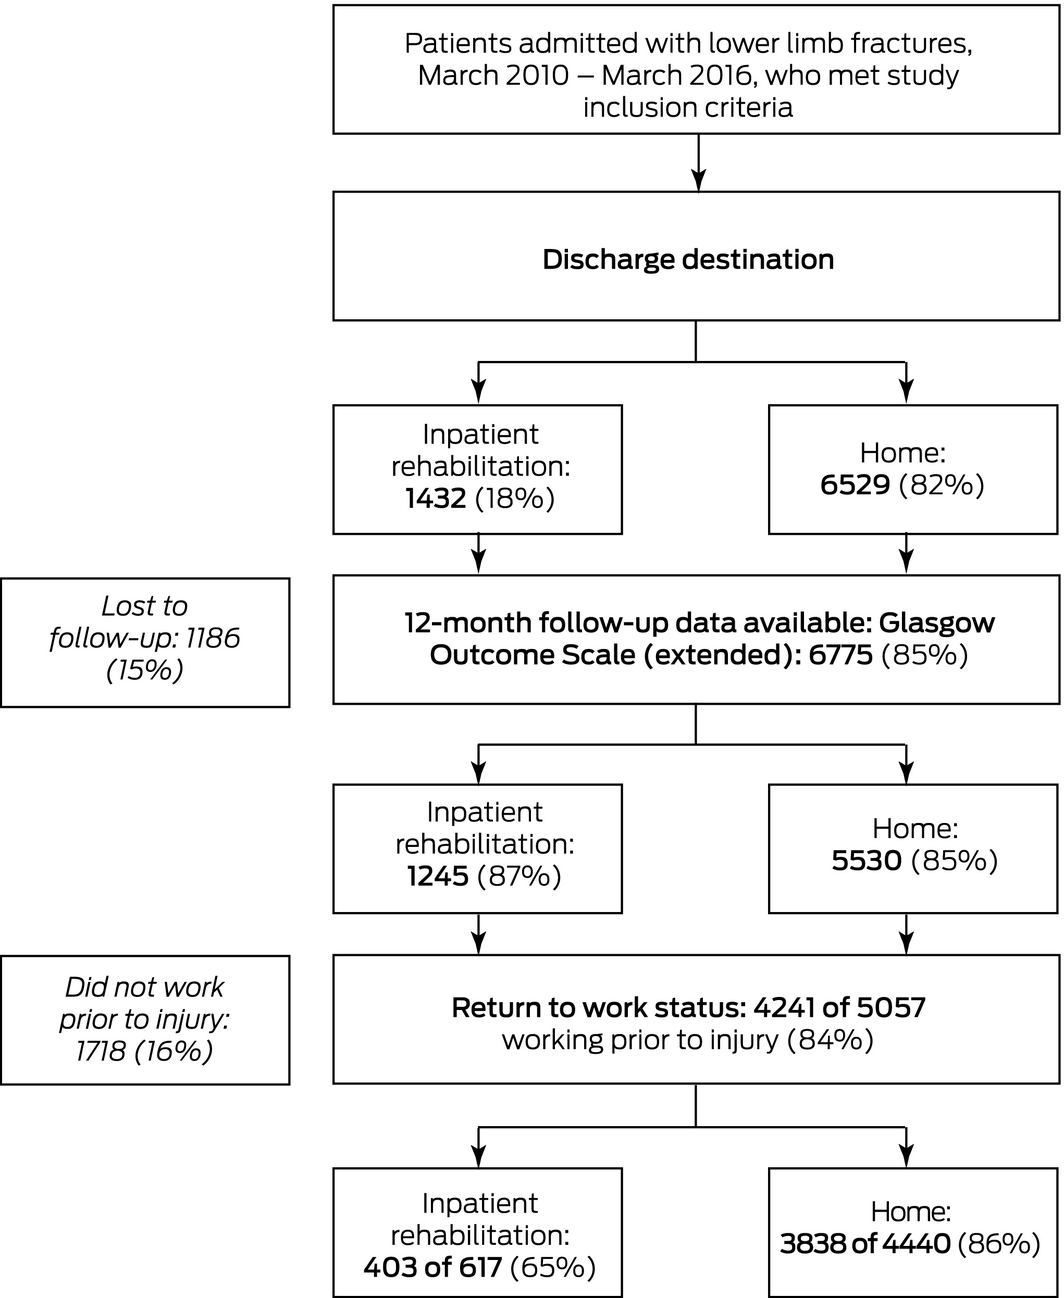
A total of 7961 patients met the inclusion criteria; 6529 (82%) were discharged directly home from hospital, 1432 (18%) were discharged to IPR. Overall, 6775 (85%) patients were followed up for 12 months (GOS‐E outcome) and were included in the final analysis. The age distribution of patients lost to follow‐up was shifted to younger groups compared with included patients, and a larger proportion were living in metropolitan Melbourne (83.5% v 75.3%); other characteristics were similar to those of followed‐up patients (Box 1; Box 2).
Compared with people discharged directly home, a larger proportion of patients discharged to IPR were women (49% v 36%), their age distribution was shifted to older groups, a greater proportion reported pre‐injury disability (42% v 15%), and a smaller proportion were working before their injury (52% v 81%). Greater proportions of patients discharged to IPR than of people discharged directly home were injured in motor vehicle crashes (10% v 6%) or low falls (40% v 30%), were compensable (33% v 25%), lived in metropolitan Melbourne (81% v 74%), and had pelvic (16% v 6%) or femur fractures (31% v 12%) (Box 3).
Functional outcome: GOS‐E
Twelve months after their injuries, 2026 patients (30%) reported upper good recovery (GOS‐E score of 8), including 1826 discharged directly home (33%) and 200 discharged to IPR (16%); 77 patients (1%) had died (33 discharged home, 44 discharged to IPR) (Supporting Information).
Crude absolute standardised differences between the two treatment groups ranged between 0.4% (IRSAD) and 67.3% (working prior to accident); after IPTW was applied, values ranged between 0.1% (other femur injury) and 15.3% (high fall). Between 28 and 43 patients were excluded from the analysis of certain covariates because they did not satisfy the common support condition. The propensity score analysis improved the matching of the groups discharged home or to IPR. The adjusted standardised differences were below 10% for all variables apart from funding source, mechanism of injury, and site of injury (highest: high fall, 15.3%) (Box 3).
The odds of reporting a better functional outcome based on the 12‐month IPTW‐adjusted propensity score estimate were 56% lower for patients discharged to IPR than for those discharged home (OR, 0.44; 95% CI, 0.37–0.51).
Functional outcome: return to work
Of the 5057 participants working prior to their injuries, 4241 (84%) had returned to work by 12 months, including 3838 (86%) discharged home and 403 (65%) discharged to IPR.
Crude absolute standardised differences ranged between 0.5% (IRSAD) and 53.6% (Medicare); IPTW‐adjusted values ranged between 0.3% (lowest IRSAD decile) and 14.0% (compensable). Between 110 and 132 patients were excluded from the analysis of certain covariates because they did not satisfy the common support condition. The standardised differences were below 10% for all variables apart from funding source (Box 4).
The odds of returning to work based on the 12‐month IPTW‐adjusted propensity score estimate were 66% lower for patients discharged to IPR than for those discharged home (OR, 0.34; 95% CI, 0.26–0.46).
Sensitivity analyses
For return to work, the upper bound of the odds ratio 95% CI included unity when the confounding function was set to 0.88 (Supporting Information). That is, unmeasured confounding must cause a 12% reduction in the likelihood of return to work for patients discharged to IPR for the difference between the two treatment groups to be statistically non‐significant.
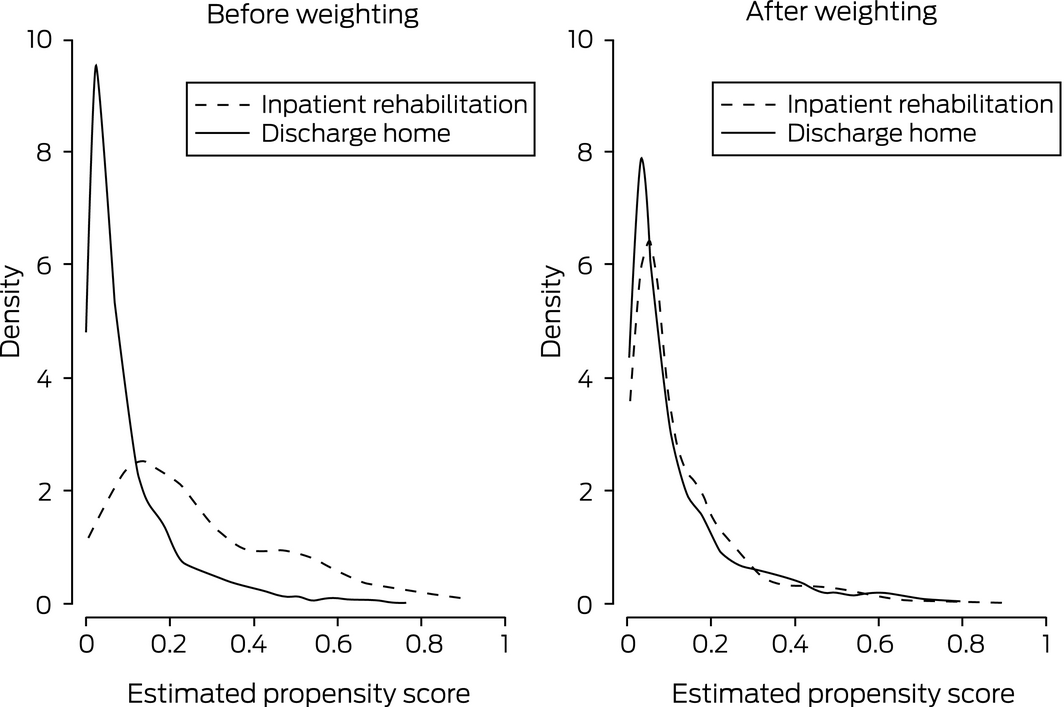
The distributions of propensity scores by discharge destination for GOS‐E (Box 5) and return to work (Box 6) before and after weighting illustrate the improvement in standardised differences after weighting. The difference between groups was greatest at low propensity for discharge to inpatient rehabilitation, but was markedly reduced after weighting.
Further sensitivity analyses found that interaction terms between discharge destination and injury type or compensable status were not statistically significant; that is, the same result was obtained for both outcomes (GOS‐E, return to work) for compensable and non‐compensable patients and for all injury types (data not shown).
Odds ratios estimated by our propensity score method and by traditional logistic regression analysis were similar (Box 7).
Discussion
The discharge options for patients after acute hospital treatment for lower limb fractures include IPR, home‐based therapy, and outpatient services.3 IPR is expensive, and high quality evidence suggests that it provides no advantage after elective orthopaedic procedures.4 It may also be associated with higher rates of septic and wound complications and of hospital re‐admission.18 Comparing the outcomes of IPR with those of other options is therefore important. Propensity score‐based analysis indicated that outcomes at 12 months were poorer for patients discharged to IPR than for those discharged home; the odds of reporting a better functional recovery or return to work were each reduced by more than 50%. However, the two treatment groups remained unbalanced with respect to funding source for both outcomes and for site and cause of injury for GOS‐E score.
The goal of propensity score analysis is to balance covariates for participants in different treatment regimens.7 Standardised differences are the preferred parameter for determining covariate balance between groups, as they are independent of sample size and place the focus on the magnitude of differences rather than their statistical significance.19 The authors of a recent study comparing the outcomes of home‐based rehabilitation and IPR after total knee arthroplasty found that IPR was more expensive but provided no added benefit; applying propensity score matching, most of their reported standardised differences were smaller than 10%.20 After IPTW adjustment of our data, standardised differences were lower than the recommended maximum (less than 20% for all covariates, and less than 10% for most16), suggesting that our results are reliable. Caution is nevertheless advisable, as the statistical approach employed may not correct for all clinical differences between groups.
Our sensitivity analysis of the outcome return to work indicated that unmeasured confounding would need to have caused a 12% change in the likelihood of return to work for patients discharged to IPR for the difference between the two destination groups to be statistically non‐significant. Given the number of confounding factors included in our analysis, we are confident that we have accounted for most potential confounding, and therefore that our finding of an association between treatment and outcome is sound. Nevertheless, some unmeasured confounding is inevitable. For example, frailty was potentially an unmeasured confounder; in another study of lower limb fractures, we found that 60% of patients discharged to IPR were frail, compared with 1% of those discharged home.21 Other potential confounders include the severity of injury and complications not measured in our study.
The aim of propensity score analysis is to establish causality on the basis of observational data. The optimal approach to our research question, however, would be an RCT. Propensity score analysis identifies which factors remained unbalanced between the groups, and can therefore inform the design of appropriate RCTs.22,23
Our findings provide insights directly relevant to clinical practice; in particular, all discharge options should be considered before referring patients to IPR after lower limb trauma. Qualitative research has found discharge destination decisions for these patients are largely determined by financial considerations. Surgeons and rehabilitation physicians do not feel responsible for discharge decision‐making, believing that it is driven by organisational factors and bed availability rather than patient‐related factors.24 In light of our findings, models for delivering trauma rehabilitation in the home or in an outpatient setting should be assessed, reserving IPR beds for patients with traumatic brain injuries and others who benefit from such treatment.25 International guidelines recommend multidisciplinary rehabilitation for patients who have had neck of femur fractures,26 and whether patients with proximal lower limb fractures, including pelvis or femur fractures, should also be offered IPR should be investigated.
Strengths and limitations
The availability of data for a large cohort of patients with a wide range of lower limb injury sites, the high follow‐up rate (more than 85%), and the inclusion of trauma patients from both Victorian adult major trauma centres as well as two community hospitals were major strengths of our study. Further, we included data on a large number of potential confounders and outcomes that are significant for patients. Additional strengths include our detailed description of our propensity score analysis methodology and disclosure of factors that remained unbalanced with this approach. Assessing whether weighting balanced the covariates is an important element of IPTW analysis that is often missing in published reports.27
As we analysed registry data, not all possible confounders could be included in our analysis, including frailty, severity of injury, and complications. Psychological health factors (pre‐ and post‐injury) may have been under‐reported, as only pre‐existing conditions relevant to the acute hospital admission are captured by ICD‐10‐AM coding. However, it is probable that these conditions were the ones most likely to influence IPR referral decisions. The Victorian no‐fault insurance system for transport accident cases provides early access to IPR at no direct cost to the claimant, and many hospitals have systems for referring patients to specialist rehabilitation hospitals; our findings may not be generalisable to jurisdictions without similar systems of trauma care. Finally, information on access to outpatient rehabilitation and the reasons for decisions regarding discharge destinations were not available.
Conclusion
Our large observational study of adult patients with isolated lower limb fractures found that discharge to IPR was associated with poorer outcomes than discharge home. Our findings should be interpreted with caution given residual (but statistically acceptable) covariate imbalances between the discharge destination groups. The factors that remained unbalanced (funding source, site and cause of injury) could be examined in trials for assessing the relationship between discharge destination and outcomes after lower limb trauma.
Box 2 – Characteristics of 7961 eligible adult patients, by availability of 12‐month Extended Glasgow Outcomes Scale (GOS‐E) data
|
Characteristic |
12‐month follow‐up data |
||||||||||||||
|
Available |
Not available |
||||||||||||||
|
|
|||||||||||||||
|
Total number of patients |
6775 |
1186 |
|||||||||||||
|
Discharge destination |
|
|
|||||||||||||
|
Home |
5530 (81.6%) |
999 (84.2%) |
|||||||||||||
|
Rehabilitation |
1245 (18.4%) |
187 (15.8%) |
|||||||||||||
|
Age group, years |
|
|
|||||||||||||
|
18–24 |
1037 (15.3%) |
203 (17.1%) |
|||||||||||||
|
25–34 |
1437 (21.2%) |
356 (30.0%) |
|||||||||||||
|
35–44 |
1287 (19.0%) |
250 (21.1%) |
|||||||||||||
|
45–54 |
1430 (21.1%) |
188 (15.9%) |
|||||||||||||
|
55–64 |
1584 (23.4%) |
189 (15.9%) |
|||||||||||||
|
Sex |
|
|
|||||||||||||
|
Men |
4198 (62.0%) |
771 (65.0%) |
|||||||||||||
|
Women |
2577 (38.0%) |
415 (35.0%) |
|||||||||||||
|
Cause of injury |
|
|
|||||||||||||
|
Motor vehicle crash |
444 (6.6%) |
111 (9.4%) |
|||||||||||||
|
Motor bike crash |
790 (11.2%) |
137 (11.6%) |
|||||||||||||
|
Pedal cyclist |
379 (16.8%) |
44 (3.7%) |
|||||||||||||
|
Pedestrian |
312 (4.6%) |
85 (7.2%) |
|||||||||||||
|
Low fall |
2162 (31.9%) |
334 (28.2%) |
|||||||||||||
|
High fall |
1003 (14.8%) |
175 (14.8%) |
|||||||||||||
|
Struck by object |
524 (7.7%) |
99 (8.3%) |
|||||||||||||
|
Other |
1161 (17.1%) |
201 (16.9%) |
|||||||||||||
|
Funding source |
|
|
|||||||||||||
|
Medicare |
3886 (58.9%) |
700 (60.9%) |
|||||||||||||
|
Compensable |
1735 (26.3%) |
336 (29.2%) |
|||||||||||||
|
Private health insurance |
981 (14.9%) |
114 (9.9%) |
|||||||||||||
|
Charlson comorbidity index score |
|||||||||||||||
|
0 |
5871 (86.4%) |
975 (82.2%) |
|||||||||||||
|
1 |
699 (10.3%) |
168 (14.2%) |
|||||||||||||
|
2 or more |
205 (3.3%) |
43 (3.6%) |
|||||||||||||
|
Region of residence (missing data: 175) |
|||||||||||||||
|
Metropolitan |
5026 (75.3%) |
930 (83.5%) |
|||||||||||||
|
Inner regional |
1465 (22.0%) |
155 (13.9%) |
|||||||||||||
|
Outer regional |
181 (2.7%) |
29 (2.6%) |
|||||||||||||
|
Site of injury |
|
|
|||||||||||||
|
Pelvis |
549 (8.1%) |
96 (8.1%) |
|||||||||||||
|
Neck of femur |
567 (8.4%) |
96 (8.1%) |
|||||||||||||
|
Femur (other) |
460 (6.8%) |
82 (6.9%) |
|||||||||||||
|
Patella |
277 (4.1%) |
34 (2.9%) |
|||||||||||||
|
Tibia/ankle |
3232 (47.7%) |
537 (45.3%) |
|||||||||||||
|
Fibula |
844 (12.5%) |
153 (12.9%) |
|||||||||||||
|
Foot |
846 (12.5%) |
188 (15.9%) |
|||||||||||||
|
|
|||||||||||||||
|
|
|||||||||||||||
Box 3 – Extended Glasgow Outcomes Scale analysis: absolute value of percentage standardised differences before and after inverse probability of treatment weighting (IPTW) propensity score analysis
|
Characteristic |
Discharge destination |
Absolute value of percentage standard difference |
|||||||||||||
|
Home |
Inpatient rehabilitation |
Unadjusted |
IPTW |
||||||||||||
|
|
|||||||||||||||
|
Number of patients |
5530 |
1245 |
|
|
|||||||||||
|
Sex |
|||||||||||||||
|
Men |
3567 (64.5%) |
631 (50.7%) |
27.8% |
0.6% |
|||||||||||
|
Women |
1963 (35.5%) |
614 (49.3%) |
27.8% |
0.6% |
|||||||||||
|
Age group, years |
|||||||||||||||
|
18–24 |
940 (17.0%) |
97 (7.8%) |
27.6% |
10.8% |
|||||||||||
|
25–34 |
1303 (23.6%) |
134 (10.8%) |
34.0% |
8.1% |
|||||||||||
|
35–44 |
1099 (19.9%) |
188 (15.1%) |
12.8% |
0.4% |
|||||||||||
|
45–54 |
1147 (20.7%) |
283 (22.7%) |
4.8% |
0.9% |
|||||||||||
|
55–64 |
1041 (18.8%) |
543 (43.6%) |
54.9% |
1.9% |
|||||||||||
|
Charlson comorbidity index score |
|||||||||||||||
|
0 |
4959 (89.7%) |
912 (73.3%) |
42.6% |
0.3% |
|||||||||||
|
1 |
473 (8.6%) |
226 (18.2%) |
28.3% |
0.2% |
|||||||||||
|
2 or more |
98 (1.8%) |
107 (8.6%) |
30.4% |
0.3% |
|||||||||||
|
Intensive care stay (missing data: 1) |
|||||||||||||||
|
Yes |
42 (0.8%) |
64 (5.1%) |
25.1% |
0.5% |
|||||||||||
|
No |
5487 (99.2%) |
1181 (94.9%) |
25.1% |
0.5% |
|||||||||||
|
Site of injury |
|
|
|
|
|||||||||||
|
Pelvis |
345 (6.2%) |
204 (16.4%) |
32.0% |
3.5% |
|||||||||||
|
Neck of femur |
338 (6.1%) |
229 (18.4%) |
38.2% |
0.4% |
|||||||||||
|
Femur (other) |
305 (5.5%) |
155 (12.4%) |
24.1% |
0.1% |
|||||||||||
|
Patella |
255 (4.6%) |
22 (1.8%) |
15.5% |
7.1% |
|||||||||||
|
Tibia/ankle |
2746 (49.7%) |
486 (39.0%) |
21.9% |
4.2% |
|||||||||||
|
Fibula |
775 (14.0%) |
69 (5.5%) |
28.5% |
14.8% |
|||||||||||
|
Foot |
766 (13.9%) |
80 (6.4%) |
24.3% |
13.2% |
|||||||||||
|
Funding source (missing data: 103) |
|||||||||||||||
|
Medicare |
3260 (60.6%) |
626 (51.2%) |
18.4% |
10.9% |
|||||||||||
|
Compensable |
1326 (24.7%) |
409 (33.4%) |
19.0% |
10.7% |
|||||||||||
|
Private health insurance |
793 (14.7%) |
188 (15.4%) |
1.4% |
1.6% |
|||||||||||
|
Mechanism of injury |
|||||||||||||||
|
Motor vehicle crash |
317 (5.7%) |
127 (10.2%) |
16.5% |
0.7% |
|||||||||||
|
Motor bike crash |
663 (12.0%) |
127 (10.2%) |
5.8% |
3.4% |
|||||||||||
|
Pedal cyclist |
337 (6.1%) |
42 (3.4%) |
12.1% |
2.5% |
|||||||||||
|
Pedestrian |
203 (3.7%) |
109 (8.8%) |
20.4% |
1.6% |
|||||||||||
|
Low fall |
1659 (30.0%) |
503 (40.4%) |
21.7% |
8.2% |
|||||||||||
|
High fall |
868 (15.7%) |
135 (10.8%) |
14.3% |
15.3% |
|||||||||||
|
Struck by object |
479 (8.7%) |
45 (3.6%) |
20.8% |
4.2% |
|||||||||||
|
Other |
1004 (18.2%) |
157 (12.6%) |
15.2% |
6.9% |
|||||||||||
|
Socio‐economic status (IRSAD) (missing data: 105) |
|||||||||||||||
|
1 (most disadvantaged) |
289 (5.3%) |
74 (6.1%) |
3.1% |
1.8% |
|||||||||||
|
2 |
260 (4.8%) |
67 (5.5%) |
3.3% |
1.4% |
|||||||||||
|
3 |
148 (2.7%) |
39 (3.2%) |
2.7% |
2.1% |
|||||||||||
|
4 |
367 (6.7%) |
90 (7.4%) |
2.4% |
4.3% |
|||||||||||
|
5 |
346 (6.4%) |
66 (5.4%) |
3.7% |
0.4% |
|||||||||||
|
6 |
508 (9.3%) |
111 (9.1%) |
1.1% |
0.8% |
|||||||||||
|
7 |
843 (15.5%) |
167 (13.7%) |
4.7% |
6.9% |
|||||||||||
|
8 |
881 (16.2%) |
194 (15.9%) |
1.0% |
7.7% |
|||||||||||
|
9 |
941 (17.3%) |
213 (17.4%) |
0.4% |
1.7% |
|||||||||||
|
10 (least disadvantaged) |
864 (15.9%) |
202 (16.5%) |
1.6% |
4.1% |
|||||||||||
|
Pre‐injury disability (missing data: 84) |
|||||||||||||||
|
None |
4684 (85.3%) |
714 (59.5%) |
61.5% |
5.2% |
|||||||||||
|
Mild |
366 (6.7%) |
192 (16.0%) |
29.1% |
1.2% |
|||||||||||
|
Moderate |
263 (4.8%) |
150 (12.5%) |
28.3% |
2.2% |
|||||||||||
|
Marked/severe |
179 (3.3%) |
143 (11.9%) |
34.9% |
4.8% |
|||||||||||
|
Working prior to accident (missing data: 78) |
|||||||||||||||
|
Yes |
4465 (81.3%) |
622 (51.7%) |
67.3% |
2.1% |
|||||||||||
|
No |
1028 (18.7%) |
582 (48.3%) |
67.3% |
2.1% |
|||||||||||
|
Education level (missing data: 408) |
|||||||||||||||
|
University |
1274 (24.2%) |
243 (22.2%) |
6.4% |
4.3% |
|||||||||||
|
Advanced diploma |
1675 (31.8%) |
291 (26.5%) |
10.5% |
3.9% |
|||||||||||
|
High school |
881 (16.7%) |
176 (16.0%) |
2.3% |
3.3% |
|||||||||||
|
Did not complete high school |
1440 (27.3%) |
387 (35.3%) |
17.9% |
2.7% |
|||||||||||
|
Residential remoteness (missing data: 103) |
|||||||||||||||
|
Major cities |
4040 (74.1%) |
986 (80.6%) |
14.8% |
0.8% |
|||||||||||
|
Inner regional |
1262 (23.2%) |
203 (16.6%) |
15.8% |
1.9% |
|||||||||||
|
Outer regional/remote |
147 (2.7%) |
34 (2.8%) |
0.6% |
4.5% |
|||||||||||
|
Mental, alcohol, drug conditions |
|||||||||||||||
|
Yes |
319 (5.8%) |
181 (14.5%) |
28.6% |
1.0% |
|||||||||||
|
No |
5211 (94.2%) |
1064 (85.5%) |
28.6% |
1.0% |
|||||||||||
|
|
|||||||||||||||
|
IRSAD = Index of Relative Socioeconomic Advantage and Disadvantage. |
|||||||||||||||
Box 4 – Return to work analysis: absolute value of percentage standard difference before and after inverse probability of treatment weighting (IPTW) propensity score analysis
|
Characteristic |
Discharge destination |
Absolute value of percentage standard difference |
|||||||||||||
|
Home |
Inpatient rehabilitation |
Unadjusted |
IPTW |
||||||||||||
|
|
|||||||||||||||
|
Number of patients |
4440 |
617 |
|
|
|||||||||||
|
Sex |
|||||||||||||||
|
Men |
3032 (68.3%) |
360 (58.3%) |
18.5% |
1.3% |
|||||||||||
|
Women |
1408 (31.7%) |
257 (41.7%) |
18.5% |
1.3% |
|||||||||||
|
Age group, years |
|||||||||||||||
|
18–24 |
860 (19.4%) |
81 (13.1%) |
13.1% |
9.0% |
|||||||||||
|
25–34 |
1156 (26.0%) |
106 (17.2%) |
20.9% |
2.2% |
|||||||||||
|
35–44 |
898 (20.2%) |
116 (18.8%) |
4.7% |
1.5% |
|||||||||||
|
45–54 |
893 (20.1%) |
142 (23.0%) |
6.1% |
0.5% |
|||||||||||
|
55–64 |
633 (14.3%) |
172 (27.9%) |
31.5% |
4.9% |
|||||||||||
|
Charlson comorbidity index score |
|||||||||||||||
|
0 |
4097 (92.3%) |
529 (85.7%) |
19.7% |
1.2% |
|||||||||||
|
1 |
307 (6.9%) |
71 (11.5%) |
15.4% |
1.5% |
|||||||||||
|
2 or more |
36 (0.8%) |
17 (2.8%) |
13.1% |
0.4% |
|||||||||||
|
Intensive care stay (missing data: 1) |
|||||||||||||||
|
Yes |
28 (0.6%) |
25 (4.1%) |
21.4% |
2.2% |
|||||||||||
|
No |
4411 (99.4%) |
592 (95.9%) |
21.4% |
2.2% |
|||||||||||
|
Site of injury |
|
|
|
|
|||||||||||
|
Pelvis |
280 (6.3%) |
144 (23.3%) |
47.3% |
5.7% |
|||||||||||
|
Neck of femur |
232 (5.2%) |
49 (7.9%) |
10.7% |
0.4% |
|||||||||||
|
Femur (other) |
242 (5.5%) |
85 (13.8%) |
27.4% |
1.0% |
|||||||||||
|
Patella |
191 (4.3%) |
9 (1.5%) |
15.8% |
5.3% |
|||||||||||
|
Tibia/ankle |
2240 (50.5%) |
256 (41.5%) |
19.4% |
3.6% |
|||||||||||
|
Fibula |
640 (14.4%) |
25 (4.1%) |
31.9% |
8.6% |
|||||||||||
|
Foot |
615 (13.9%) |
49 (7.9%) |
18.9% |
3.1% |
|||||||||||
|
Funding source (missing data: 130) |
|||||||||||||||
|
Medicare |
2434 (56.3%) |
176 (29.1%) |
53.6% |
11.5% |
|||||||||||
|
Compensable |
1205 (27.9%) |
324 (53.6%) |
51.1% |
14.0% |
|||||||||||
|
Private health insurance |
683 (15.8%) |
105 (17.4%) |
3.5% |
3.1% |
|||||||||||
|
Mechanism of injury |
|||||||||||||||
|
Motor vehicle crash |
258 (5.8%) |
94 (15.2%) |
29.6% |
2.2% |
|||||||||||
|
Motor bike crash |
611 (13.8%) |
111 (18.0%) |
11.2% |
5.4% |
|||||||||||
|
Pedal cyclist |
299 (6.7%) |
37 (6.0%) |
2.3% |
1.6% |
|||||||||||
|
Pedestrian |
167 (3.8%) |
71 (11.5%) |
27.2% |
2.1% |
|||||||||||
|
Low fall |
1182 (26.6%) |
132 (21.4%) |
11.4% |
10.0% |
|||||||||||
|
High fall |
677 (15.2%) |
74 (12.0%) |
9.7% |
9.5% |
|||||||||||
|
Struck by object |
413 (9.3%) |
28 (4.5%) |
18.0% |
2.7% |
|||||||||||
|
Other |
833 (18.8%) |
70 (11.3%) |
19.2% |
5.4% |
|||||||||||
|
Socio‐economic status (IRSAD) (missing data: 74) |
|||||||||||||||
|
1 (most disadvantaged) |
180 (4.1%) |
31 (5.1%) |
5.3% |
0.3% |
|||||||||||
|
2 |
186 (4.2%) |
24 (4.0%) |
2.5% |
1.0% |
|||||||||||
|
3 |
116 (2.6%) |
22 (3.6%) |
0.5% |
0.8% |
|||||||||||
|
4 |
278 (6.3%) |
30 (5.0%) |
3.0% |
1.6% |
|||||||||||
|
5 |
284 (6.5%) |
36 (6.0%) |
1.8% |
0.6% |
|||||||||||
|
6 |
398 (9.1%) |
63 (10.4%) |
2.6% |
2.7% |
|||||||||||
|
7 |
698 (15.9%) |
88 (14.6%) |
2.0% |
4.3% |
|||||||||||
|
8 |
712 (16.3%) |
100 (16.6%) |
1.9% |
2.1% |
|||||||||||
|
9 |
804 (18.4%) |
115 (19.0%) |
0.7% |
2.7% |
|||||||||||
|
10 (least disadvantaged) |
723 (16.5%) |
95 (15.7%) |
0.8% |
3.0% |
|||||||||||
|
Pre‐injury disability (missing data: 7) |
|||||||||||||||
|
None |
4125 (93.0%) |
520 (84.7%) |
25.3% |
8.8% |
|||||||||||
|
Mild |
197 (4.4%) |
61 (9.9%) |
20.4% |
1.7% |
|||||||||||
|
Moderate |
77 (1.7%) |
17 (2.8%) |
6.9% |
8.2% |
|||||||||||
|
Marked/severe |
37 (0.8%) |
16 (2.6%) |
12.7% |
8.5% |
|||||||||||
|
Occupation (missing data: 140) |
|||||||||||||||
|
Managers and administrators |
346 (8.0%) |
46 (7.6%) |
1.3% |
0.8% |
|||||||||||
|
Professionals |
805 (18.5%) |
123 (20.3%) |
2.7% |
2.9% |
|||||||||||
|
Associate professionals |
487 (11.2%) |
54 (8.9%) |
6.4% |
1.9% |
|||||||||||
|
Tradespersons |
1088 (25.1%) |
108 (17.9%) |
15.9% |
2.1% |
|||||||||||
|
Advanced clerical |
105 (2.4%) |
17 (2.8%) |
1.6% |
2.4% |
|||||||||||
|
Intermediate clerical |
406 (9.4%) |
54 (8.9%) |
1.5% |
6.3% |
|||||||||||
|
Intermediate production/transport |
328 (7.6%) |
69 (11.4%) |
12.9% |
7.3% |
|||||||||||
|
Elementary clerical and sales |
181 (4.2%) |
28 (4.6%) |
2.5% |
5.8% |
|||||||||||
|
Labourers and related |
305 (7.0%) |
55 (9.1%) |
6.4% |
2.7% |
|||||||||||
|
Student |
291 (6.7%) |
51 (8.4%) |
6.6% |
2.9% |
|||||||||||
|
Education level (missing data: 110) |
|||||||||||||||
|
University |
1151 (26.6%) |
169 (28.3%) |
1.8% |
4.5% |
|||||||||||
|
Advanced diploma |
729 (16.9%) |
97 (16.2%) |
1.7% |
7.1% |
|||||||||||
|
High school |
1464 (33.9%) |
196 (32.8%) |
1.8% |
3.8% |
|||||||||||
|
Did not complete high school |
976 (22.6%) |
135 (22.6%) |
1.6% |
6.7% |
|||||||||||
|
Residential remoteness (missing data: 73) |
|||||||||||||||
|
Major cities |
3240 (74.0%) |
472 (78.1%) |
6.5% |
2.0% |
|||||||||||
|
Inner regional |
1023 (23.4%) |
110 (18.2%) |
9.5% |
0.7% |
|||||||||||
|
Outer regional/remote |
117 (2.7%) |
22 (3.6%) |
6.0% |
5.4% |
|||||||||||
|
Mental, alcohol, drug conditions |
|||||||||||||||
|
Yes |
203 (4.6%) |
57 (9.2%) |
17.8% |
0.4% |
|||||||||||
|
No |
4237 (95.4%) |
560 (90.8%) |
17.8% |
0.4% |
|||||||||||
|
|
|||||||||||||||
|
IRSAD = Index of Relative Socioeconomic Advantage and Disadvantage. |
|||||||||||||||
Box 5 – Extended Glasgow Outcome Scale (GOS‐E) scores: distribution of propensity scores by discharge destination, before and after inverse probability of treatment weighting
Box 6 – Return to work: distribution of propensity scores by discharge destination, before and after inverse probability of treatment weighting
Box 7 – Extended Glasgow Outcome Scale (GOS‐E) scores and return to work: odds ratios (with 95% confidence intervals) estimated by logistic or ordinal logistic regression and by propensity scoring methods
|
|
GOS‐E |
Return to work |
|||||||||||||
|
|
|||||||||||||||
|
Univariate |
0.30 (0.26–0.33) |
0.30 (0.25–0.36) |
|||||||||||||
|
Multivariate |
0.46 (0.40–0.53) |
0.38 (0.30–0.48) |
|||||||||||||
|
Propensity scoring with IPTW |
0.44 (0.27–0.51) |
0.34 (0.26–0.46) |
|||||||||||||
|
|
|||||||||||||||
|
IPTW = inverse probability of treatment weighting. |
|||||||||||||||
Received 9 June 2019, accepted 30 October 2019
- Lara A Kimmel1,2
- Pamela M Simpson2
- Anne E Holland1,2,3
- Elton R Edwards1,2
- Peter A Cameron1,2
- Richard S Steiger4
- Richard S Page5,6,7
- Raphael Hau8
- Andrew Bucknill9,10
- Jessica Kasza1
- Belinda J Gabbe1,11
- 1 Monash University, Melbourne, VIC
- 2 The Alfred Hospital, Melbourne, VIC
- 3 La Trobe University, Melbourne, VIC
- 4 Epworth Healthcare, University of Melbourne, Melbourne, VIC
- 5 Barwon Health, Geelong, VIC
- 6 St John of God Hospital, Geelong, VIC
- 7 Deakin University, Geelong, VIC
- 8 Box Hill Hospital, Melbourne, VIC
- 9 Royal Melbourne Hospital, Melbourne, VIC
- 10 University of Melbourne, Melbourne, VIC
- 11 Health Data Research UK, Swansea University Medical School, Swansea University, United Kingdom
We thank the Victorian Orthopaedic Trauma Outcomes Registry (VOTOR) telephone interviewers, the VOTOR Steering Committee, and the hospitals participating in the VOTOR. The VOTOR is funded by the Transport Accident Commission. Belinda Gabbe was supported by an Australian Research Council Future Fellowship (FT170100048).
No relevant disclosures.
- 1. Taylor NF, Harding KE, Dowling J, Harrison G. Discharge planning for patients receiving rehabilitation after hip fracture: a qualitative analysis of physiotherapists’ perceptions. Disabil Rehabil 2010; 32: 492–429.
- 2. Williamson OD, Epi GD, Gabbe BJ, et al. Predictors of moderate or severe pain 6 months after orthopaedic injury: a prospective cohort study. J Orthop Trauma 2009; 23: 139–144.
- 3. Zeidler J, Mittendorf T, Vahldiek G, et al. Comparative cost analysis of outpatient and inpatient rehabilitation for musculoskeletal diseases in Germany. Rheumatology (Oxford) 2008; 47: 1527–1534.
- 4. Buhagiar MA, Naylor JM, Harris IA, et al. Effect of inpatient rehabilitation vs a monitored home‐based program on mobility in patients with total knee arthroplasty: the HIHO randomized clinical trial. JAMA 2017; 317: 1037–1046.
- 5. Hannan EL. Randomized clinical trials and observational studies: guidelines for assessing respective strengths and limitations. JACC Cardiovasc Interv 2008; 1: 211–217.
- 6. Mann CJ. Observational research methods. Research design II: cohort, cross sectional, and case–control studies. Emerg Med J 2003; 20: 54–60.
- 7. Williamson EJ, Forbes A. Introduction to propensity scores. Respirology 2014; 19: 625–635.
- 8. Edwards ER, Graves SE, McNeil JJ, et al. Orthopaedic trauma: establishment of an outcomes registry to evaluate and monitor treatment effectiveness. Injury 2006; 37: 95–96.
- 9. Australian Bureau of Statistics. 2033.0.55.001. Census of population and housing: Socio‐Economic Indexes for Areas (SEIFA), Australia, data only, 2006. Mar 2008. http://www.abs.gov.au/AUSSTATS/abs@.nsf/DetailsPage/2033.0.55.0012006?OpenDocument (viewed Aug 2019).
- 10. Charlson ME, Pompei P, Ales KL, MacKenzie CR. A new method of classifying prognostic comorbidity in longitudinal studies: development and validation. J Chronic Dis 1987; 40: 373–383.
- 11. Wilson JT, Pettigrew LE, Teasdale GM. Structured interviews for the Glasgow Outcome Scale and the extended Glasgow Outcome Scale: guidelines for their use. J Neurotrauma 1998; 15: 573–585.
- 12. Australian Department of Human Services. What's covered by Medicare. Updated May 2019. https://www.humanservices.gov.au/individuals/subjects/medicare-services (viewed Aug 2019).
- 13. Austin PC. An introduction to propensity score methods for reducing the effects of confounding in observational studies. Multivariate Behav Res 2011; 46: 399–424.
- 14. Williamson E, Morley R, Lucas A, Carpenter J. Propensity scores: from naive enthusiasm to intuitive understanding. Stat Methods Med Res 2012; 21: 273–293.
- 15. Lunceford JK, Davidian M. Stratification and weighting via the propensity score in estimation of causal treatment effects: a comparative study. Stat Med 2004; 23: 2937–2960.
- 16. Stuart EA. Matching methods for causal inference: a review and a look forward. Stat Sci 2010; 25: 1–21.
- 17. Kasza J, Wolfe R, Schuster T. Assessing the impact of unmeasured confounding for binary outcomes using confounding functions. Int J Epidemiol 2017; 46: 1303–1311.
- 18. Fu MC, Samuel AM, Sculco PK, et al. Discharge to inpatient facilities after total hip arthroplasty is associated with increased postdischarge morbidity. J Arthroplasty 2017; 32 (9 Suppl): S144–S149.e1.
- 19. Austin PC. Propensity‐score matching in the cardiovascular surgery literature from 2004 to 2006: a systematic review and suggestions for improvement. J Thorac Cardiovasc Surg 2007; 134: 1128–1135.
- 20. Naylor JM, Hart A, Mittal R, et al. The value of inpatient rehabilitation after uncomplicated knee arthroplasty: a propensity score analysis. Med J Aust 2017; 207: 250–255. https://www.mja.com.au/journal/2017/207/6/value-inpatient-rehabilitation-after-uncomplicated-knee-arthroplasty-propensity
- 21. Kimmel LA, Holland AE, Simpson PM, et al. Validating a simple discharge planning tool following hospital admission for an isolated lower limb fracture. Phys Ther 2014; 94: 1005–1013.
- 22. Anglemyer A, Horvath HT, Bero L. Healthcare outcomes assessed with observational study designs compared with those assessed in randomized trials. Cochrane Database Syst Rev 2014; MR000034.
- 23. Ioannidis JP, Haidich AB, Pappa M, et al. Comparison of evidence of treatment effects in randomized and nonrandomized studies. JAMA 2001; 286: 821–830.
- 24. Kimmel LA, Holland AE, Lannin N, et al. Clinicians’ perceptions of decision making regarding discharge from public hospitals to in‐patient rehabilitation following trauma. Aust Health Rev 2017; 41: 192–200.
- 25. Khan F, Baguley IJ, Cameron ID. Rehabilitation after traumatic brain injury. Med J Aust 2003; 178: 290–295. https://www.mja.com.au/journal/2003/178/6/4-rehabilitation-after-traumatic-brain-injury.
- 26. National Institute for Health and Care Excellence. Hip fracture: management (CG124). Updated May 2017. https://www.nice.org.uk/guidance/cg124 (viewed Aug 2019).
- 27. Austin PC, Stuart EA. Moving towards best practice when using inverse probability of treatment weighting (IPTW) using the propensity score to estimate causal treatment effects in observational studies. Stat Med 2015; 34: 3661–3679.
Abstract
Objectives: To examine the association between discharge destination (home or inpatient rehabilitation) for adult patients treated in hospital for isolated lower limb fractures and patient‐reported outcomes.
Design: Review of prospectively collected Victorian Orthopaedic Trauma Outcomes Registry (VOTOR) data.
Setting, participants: Adults (18–64 years old) treated for isolated lower limb fractures at four Melbourne trauma hospitals that contribute data to the VOTOR, 1 March 2007 – 31 March 2016.
Main outcome measures: Return to work and functional recovery (assessed with the extended Glasgow Outcomes Scale, GOS‐E); propensity score analysis of association between discharge destination and outcome.
Results: Of 7961 eligible patients, 1432 (18%) were discharged to inpatient rehabilitation, and 6775 (85%) were followed up 12 months after their injuries. After propensity score adjustment, the odds of better functional recovery were 56% lower for patients discharged to inpatient rehabilitation than for those discharged directly home (odds ratio, 0.44; 95% CI, 0.37–0.51); for the 5057 people working before their accident, the odds of return to work were reduced by 66% (odds ratio, 0.34; 95% CI, 0.26–0.46). Propensity score analysis improved matching of the discharge destination groups, but imbalances in funding source remained for both outcome analyses, and for also for site and cause of injury in the GOS‐E analysis (standardised differences, 10–16%).
Conclusions: Discharge to inpatient rehabilitation after treatment for isolated lower limb fractures was associated with poorer outcomes than discharge home. Factors that remained unbalanced after propensity score analysis could be assessed in controlled trials.