


The known: The NHMRC recommends that people with blood lead levels exceeding 5 μg/dL should be investigated. No safe limit for children has been defined, and Australian data on levels in children are limited.
The new: The geometric mean blood lead level in 523 pre‐school children in the Barwon region of Victoria was 0.97 μg/dL; none had levels above 5 μg/dL. Children living in houses 50 years or more old had higher levels.
The implications: Blood lead levels in this sample of children were low in comparison with previous Australian surveys, but recommendations regarding minimising exposure to historical lead sources remain appropriate.
Lead is a neurotoxic heavy metal.1 At the beginning of the 20th century, Queensland doctors John Lockhart Gibson (1860–1944)2 and Alfred Jefferis Turner (1861–1947)3 linked lead poisoning in children with the lead content of house paint. By the 1990s, epidemiological research overseas4,5,6 and in Australia7,8 had established that lead impaired child development at much lower levels than previously thought, and a safe limit for children has not been defined.9,10 Following its 2015 review, the National Health and Medical Research Council recommended investigation of and reduction of lead exposure for people in Australia with blood lead levels above 5 μg/dL.1
Once in the environment, lead persists in dust and soil until physically removed, and the potential for ingestion by small children is of particular concern.1 Major regulatory approaches to reducing lead exposure in Australia have included restricting the lead content of house paint to a maximum 1% (since 1965), and banning lead in petrol (since 2002).1 By 2009–10, median blood lead levels in adults in Victoria had declined from more than 10 μg/dL11 to 1.0 μg/dL,12 but there are no recent general population data for Australian children.
Blood lead levels in children are regularly surveyed in the United States; in 2015–16, the geometric mean level for 1–5‐year‐olds was 0.76 μg/dL.13 In Australia, blood lead surveillance in children, focused on geographically defined groups at particular risk of lead exposure, has found evidence of ongoing exposure at worrying levels. The Mount Isa Lead Health Management Committee reported a geometric mean blood lead level of 2 μg/dL for 189 children in 2017, and 11% of children had levels above 5 μg/dL.14 In Port Pirie, the geometric mean blood lead level for 496 children under 5 years of age was 4.2 μg/dL in 2018, and almost half had levels above 5 μg/dL.15
The most recent data for Australian children outside special risk populations are for Fremantle in 2005.16 Although the reported geometric mean blood lead level (1.83 μg/dL) was substantially lower than that found by the only Australian national survey of levels in children (5.3 μg/dL, in 1995),17 8% of the surveyed children had blood lead levels above 5 μg/dL.16
We aimed to reduce uncertainty about blood lead levels in Australian children by surveying pre‐school children in the Barwon Infant Study, a population birth cohort study.18 The Barwon region — southwest of Melbourne and including Geelong, the second largest city in Victoria — has a long industrial history but no major directly lead‐based industries. We also evaluated factors that might influence blood lead levels in this population. We hypothesised that exposure to lead‐containing paint would be a key factor in this region — a large proportion of houses in the region were constructed before regulations regarding lead in house paint were tightened — and that levels would consequently be higher among children living in buildings more than 50 years old. We also hypothesised that associations between factors such as home renovation and blood lead levels would be stronger for children in older homes.
Methods
Participants
The aims, methodology, and socio‐demographic characteristics of the Barwon Infant Study have been described previously.18 Briefly, women were recruited at up to 28 weeks’ pregnancy during June 2010 – June 2013 at the two hospitals in the Barwon region where 95% of live births in the region during this period took place. About one in three eligible families agreed to participate; refusal was predominantly attributed to the heavy biospecimen burden of the study for respondents.18 Data on non‐participants were collected to facilitate adjustment by propensity weighting of respondent data to reflect all births. Infants were excluded from the Barwon Infant Study birth cohort if they were born at earlier than 32 weeks’ gestation, had major congenital malformations or disease, or had a serious illness during their first week of life. Questionnaire data (demographic, lifestyle, and health‐related factors) and biological samples were prospectively collected at birth, at 4 weeks, 3, 6, 9, 12 and 18 months, and at 2 and 4 years of age.18 Blood lead levels were measured as an optional component of the pre‐school review of children at about 4 years of age. Of the 1074 infants in the inception cohort, 708 (66%) underwent the pre‐school review and were therefore eligible for our lead level study.
Quantification of blood lead levels
Whole blood was collected in preservative‐free sodium heparin tubes, stored at –80°C, and shipped on dry ice. Blood lead was measured in a PerkinElmer Elan DRC II analyser with a validated inductively coupled plasma mass spectrometry (ICP‐MS) method at SA Pathology, a National Association of Testing Authorities‐accredited laboratory; the intra‐assay coefficient of variation was 3.72%, sensitivity 0.1 μg/dL, and detection limit 0.21 μg/dL (0.01 μmol/L).
Additional study measures
Child sex was recorded at birth; age and weight were recorded when blood lead was measured. Data on maternal education and household Index of Relative Socio‐Economic Disadvantage by residential address19 were collected in baseline questionnaires during pregnancy; household income was recorded as the mean of the values during pregnancy and one year after birth.
Based on National Pollutant Inventory data (www.npi.gov.au/npidata), Point Henry was selected as a regionally significant site of interest for industrial airborne lead emissions during the lifetime of the participating children. The lead emissions of the Point Henry aluminium smelter, which operated between 1962 and 2015, were at much lower levels than those associated with industries that are more intensively involved with lead, but the smelter was nevertheless a regionally significant focal source for the Barwon region. The distance from current residence of the child to Point Henry (longitude, 144.425; latitude, –38.132) was calculated, censored at 50 km to maintain relevance to lead sources in the Barwon region.
Factors that might influence blood lead level were examined in subgroup analyses of participants living at the same addresses at the 2‐ and 4‐year reviews (ie, excluding families who had moved recently), by age of home. Factors related to exposure to historical lead paint in the family residence — building age, use of external weatherboard, flooring type, home renovations in the two years preceding the pre‐school review, and pet ownership — were examined by questionnaire at the pre‐school review. Factors related to exposure to or ingestion of dust or dirt by children included frequency of sand and soil exposure (collected at 12 months of age), frequency of hand washing, bathing and showering (at 2 and 4 years of age), and frequency of certain hand–mouth behaviours (collected with the Child Behavior Checklist for ages 1½–520 at 2 years of age). Parental occupational and recreational risk factors were prospectively collected from 260 families who had participated in an optional home visit at 9–11 months of age.
Statistical analysis
Descriptive statistics for blood lead levels were calculated with and without propensity weighting. Briefly, the inverse probability of participation was calculated according to available data, including mother's age at conception, socio‐economic status by postcode,19 and family history of asthma and eczema (immune system development is a particular focus of the Barwon Infant Study). These probabilities were used as weights for adjusting for initial non‐participation and subsequent attrition.21,22
The distribution of blood lead levels approximated, as expected,18 a log normal distribution, and values were transformed to natural logarithms for evaluating the influence of potential factors in univariable and multivariable linear regressions.23 As we anticipated that domicile contamination by historical lead paint would be an important source of exposure, and that living in a house 50 years or more old would therefore be a key risk factor, we present these findings stratified by home age.
A non‐linear relationship between distance from Point Henry and blood lead level was anticipated because of the radial dispersion of airborne industrial lead emissions. The relationship was evaluated by fitting a series of eight non‐linear models using fractional polynomial analysis including integer and fractional powers and exponential and logarithmic functions, with adjustment for household income and age of home. The best‐fitting model, defined as that with the lowest total deviance, was compared with a linear model in a partial F test.
All analyses were conducted in Stata 15.0.
Ethics approval
The Barwon Infant Study was approved by the Barwon Health Human Research and Ethics Committee (reference, 10/24). Parents or guardians provided written informed consent at pre‐natal recruitment and at the pre‐school review. Study protocols included notifying the Victorian Department of Health (now Department of Health and Human Services Victoria) and further investigation of children with blood lead levels exceeding 5 μg/dL.
Results
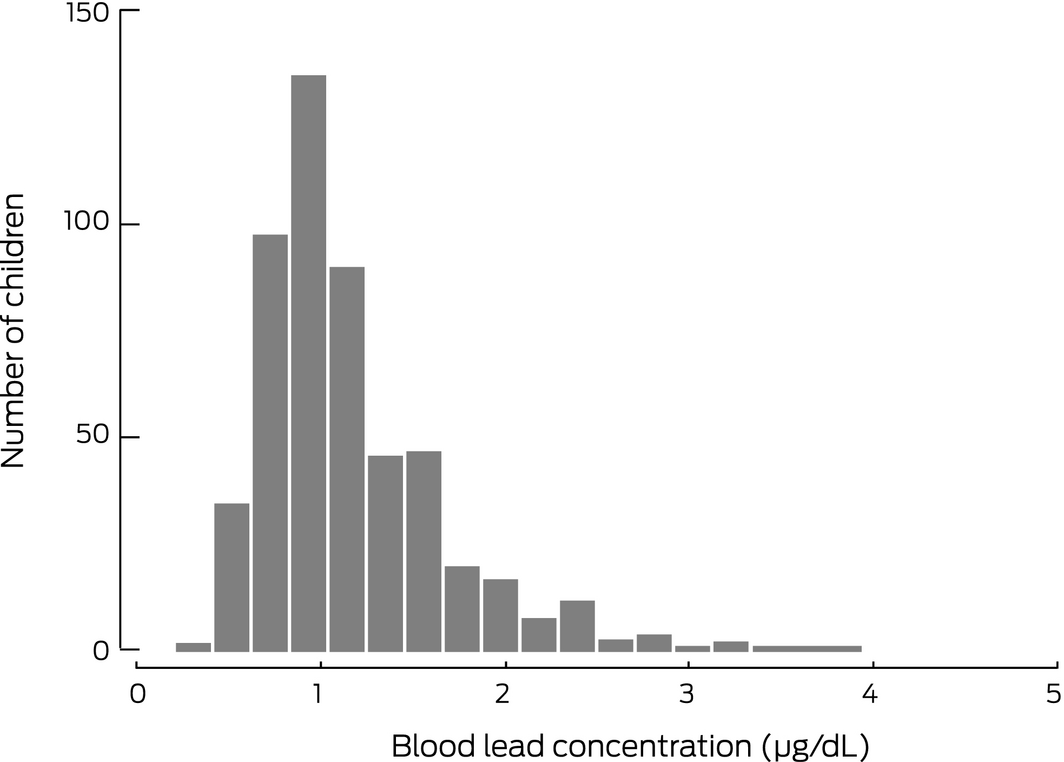
The characteristics of the participants are summarised in Box 1. Blood lead was measured in 523 of the 708 children who underwent the pre‐school review at 4 years of age (74%; 49% of the Barwon Infant Study cohort); the median value was 0.8 μg/dL (97.5th percentile, 2.28 μg/dL; range, 0.2–3.7 μg/dL) (Box 2). The geometric mean blood lead level of participants was 0.95 μg/dL (95% confidence interval [CI], 0.92–0.99 μg/dL); after propensity weighting, the estimated population geometric mean was 0.97 μg/dL (95% CI, 0.92–1.02 μg/dL).
Blood lead level was not statistically associated with child age, sex, or weight. Family homes 50 years old or more, lower household income, and living 5–10 km (v > 10 km) from Point Henry were each associated with higher blood lead level in unadjusted and adjusted analyses (Box 3). As only seven children lived less than 5 km from Point Henry (a large proportion of this area was not zoned for residential housing), statistically reliable blood level estimates for this range were not possible.
The best fitting model for the relationship between distance from Point Henry and blood lead level, after adjusting for socio‐economic status and home age, was an inverse square distance curve (Box 4). In this model, increasing distance from Point Henry was associated with lower blood lead levels (P = 0.002).
In subgroup analyses restricted to the 307 children at the same addresses at the 2‐ and 4‐year reviews, the only house‐related factor that influenced blood lead levels was any household pet, and then only for children living in houses at least 50 years old. Similarly, several child‐related factors (eats or drinks non‐food items, contact with sand most weeks, bathing frequency) influenced blood lead levels, but only for children living in houses at least 50 years old (Box 5).
As most parents did not report occupational and recreational activities related to lead exposure (Box 1), this factor was not assessed.
Discussion
The geometric mean blood lead level of the 523 4‐year‐old children in our study (0.97 μg/dL) was about half that reported from the most recent study of children in the general Australian population (2005; 1.83 μg/dL),16 and lower than that reported for adults in Victoria in 2009–10 (1.4 μg/dL).12 None of the children in our study had blood levels exceeding 5 μg/dL, the threshold for notification and investigation recommended by the NHMRC;1 indeed, the highest level measured was 3.7 μg/dL, suggesting that regulatory measures for reducing the lead exposure of children in the general Australian population have been effective. The geometric mean level, however, was higher than reported for pre‐school children in the general US population in 2015–16 (mean, 0.76 μg/dL).13
Living in an older house (at least 50 years old) was associated with higher blood lead levels, both before and after adjusting for mean household income and distance from Point Henry. This association is consistent with the restriction of the lead content of house paint since 1965.1 In analyses restricted to children living at the same addresses during the 2‐ and 4‐year reviews, statistically significant associations between several other factors (pet ownership, frequent sand contact, ingestion of non‐food items, lower frequency of bathing) and blood lead levels were evident only for children living in older homes. Lead contamination of soil is common in Australian cities,24 and blood lead levels in children have been correlated with its levels in soil and dust.24,25
Our findings support current recommendations for reducing exposure of children to lead in the home, including reducing the risks connected with sand contamination, and lead‐containing paint.26 Our subgroup finding that more frequent showering or bathing by children in older houses was associated with lower blood lead levels may suggest that such washing reduces exposure, but confirmatory studies are required.
The association between lower household income and higher blood lead level is consistent with reports linking socio‐economic disadvantage with exposure to chemical hazards.27 Further studies may clarify the specific factors that mediate the association.
Living closer to a historical source of airborne lead was also associated with higher blood lead levels. The Point Henry aluminium smelter, closed in 2015, had been regionally important as a source of airborne lead; mean annual emissions during the 5 years preceding its closure were 118 kg (www.npi.gov.au/npidata). Our finding is similar to the recently reported association between distance from the silver/zinc/lead mine and blood lead levels in children in Broken Hill,28 where annual lead emissions in 2017/18 were 33 tonnes (www.npi.gov.au/npidata).
Strengths and limitations of our study
The sample of children in our study was population‐derived, and we applied propensity weighting to render it more representative of all children in the Barwon region. The availability of data collected between birth and 4 years of age enabled assessment of factors that may influence blood lead levels; further, it is generally difficult to obtain blood samples from pre‐school children in community settings, and the participation rate for this component of the study (74%) was high.
However, we evaluated blood lead levels in only one region and in children within a narrow age range, and our results may not be representative of other regions and age groups. As is standard in studies involving population‐based general birth cohorts, data on covariates was self‐reported in questionnaires. We did not have the opportunity to directly measure local levels of lead in house paint or soil.
While we found evidence that historical household and industrial sources of lead may influence current blood lead levels in children, all measured values were below 5 μg/dL. Our subgroup analyses were not statistically powered to detect differences in the assessed outcomes (and were not adjusted for multiple testing); these findings require investigation in larger studies. However, these findings suggest that it may be important to not consider risk factors such as child ingestion of non‐food items in isolation, but in the context of the age of the home. This context has not been taken into account in most past studies.
Conclusion
Our community‐based survey found that blood lead levels in pre‐school children in the Barwon region are low compared with historical Australian levels and with recent Australian surveys of children in areas at special risk.13,14 As no safe limit of exposure for children has been established,9,10 minimising exposure to lead remains essential. Even in our low exposure group, house age (exposure to lead paint) and proximity to Point Henry (exposure to airborne lead) were relevant determinants of blood lead levels in children. The relationship between socio‐economic disadvantage and higher blood lead levels, although perhaps unsurprising, is nevertheless worrying from both the health and social justice perspectives.
Box 1 – Characteristics of the 523 children whose blood lead levels were assessed during the Barwon Infant Study pre‐school review
|
Characteristic |
Participants with available data |
Summary statistic |
|||||||||||||
|
|
|||||||||||||||
|
Child age (years), mean (SD) |
523 |
4.2 (0.3) |
|||||||||||||
|
Child sex (boys) |
523 |
276 (52.8%) |
|||||||||||||
|
Child weight (kg), mean (SD) |
494 |
17.6 (2.4) |
|||||||||||||
|
Mother's education (highest level) |
521 |
|
|||||||||||||
|
Did not complete secondary education |
|
28 (5.4%) |
|||||||||||||
|
Year 12 or equivalent, diploma, apprenticeship, trade certificate |
|
183 (35.1%) |
|||||||||||||
|
University degree |
|
310 (59.5%) |
|||||||||||||
|
Annual household income, mean (SD)* |
520 |
$96 500 ($32 800) |
|||||||||||||
|
Index of Relative Socio‐economic Disadvantage |
522 |
|
|||||||||||||
|
Lowest tertile (most disadvantaged) |
|
160 (30.7%) |
|||||||||||||
|
Middle tertile |
|
180 (34.5%) |
|||||||||||||
|
Highest tertile (least disadvantaged) |
|
182 (34.9%) |
|||||||||||||
|
Age of family home |
434 |
|
|||||||||||||
|
Less than 20 years |
|
192 (44.2%) |
|||||||||||||
|
20–49 years |
|
129 (29.7%) |
|||||||||||||
|
50 years or more |
|
113 (26.0%) |
|||||||||||||
|
Distance of home from Point Henry (km), median (IQR) |
515 |
11 (8.3–25) |
|||||||||||||
|
Distance of home from Point Henry (km), by range |
|
|
|||||||||||||
|
< 5 |
|
7 (1%) |
|||||||||||||
|
5–10 |
|
189 (36.7%) |
|||||||||||||
|
> 10 |
|
319 (61.9%) |
|||||||||||||
|
Changes of residence in past two years |
427 |
|
|||||||||||||
|
None |
|
307 (71.9%) |
|||||||||||||
|
One |
|
94 (22%) |
|||||||||||||
|
Two or more |
|
26 (6.1%) |
|||||||||||||
|
Major renovation of home in past 2 years |
519 |
85 (16%) |
|||||||||||||
|
Occupational or recreational risk factors for lead exposure (either parent)† |
260 |
|
|||||||||||||
|
Painting cars or bicycles |
|
8 (3%) |
|||||||||||||
|
Soldering pipes or metal |
|
15 (5.8%) |
|||||||||||||
|
Soldering electronic parts |
|
11 (4.2%) |
|||||||||||||
|
Working with stained glass |
|
1 (0.4%) |
|||||||||||||
|
Use of artists’ paints |
|
21 (8.1%) |
|||||||||||||
|
Working with pottery or glazes |
|
2 (0.8%) |
|||||||||||||
|
Reloading bullets, target shooting or hunting |
|
13 (5.0%) |
|||||||||||||
|
Making bullets or fishing sinkers |
|
1 (0.4%) |
|||||||||||||
|
|
|||||||||||||||
|
IQR = interquartile range; SD = standard deviation. * Mean of household income during pregnancy and first year after child's birth. † Occupational and recreational activities were evaluated in a sub‐study at 9–11 months of age (including 260 infants whose blood lead levels were also measured at 4 years of age). |
|||||||||||||||
Box 2 – Distribution of blood lead levels in 523 children assessed during the pre‐school review of the Barwon Infant Study
Box 3 – Child‐related, socio‐demographic and residential factors, and blood lead levels in 523 children at 4 years of age
|
Characteristic |
Mean difference (95% CI) in blood lead level (natural log units) |
||||||||||||||
|
Unadjusted |
P |
Adjusted* |
P |
||||||||||||
|
|
|||||||||||||||
|
Child‐related factors |
|
|
|
|
|||||||||||
|
Age (per year) |
0.00 (–0.12 to 0.13) |
0.96 |
0.03 (–0.11 to 0.16) |
0.71 |
|||||||||||
|
Sex (boys v girls) |
0.05 (–0.03 to 0.13) |
0.22 |
0.06 (–0.02 to 0.15) |
0.15 |
|||||||||||
|
Weight (per kg) (N = 494) |
–0.003 (–0.011 to 0.006) |
0.51 |
–0.003 (–0.011 to 0.006) |
0.53 |
|||||||||||
|
Socio‐demographic factors |
|
|
|
|
|||||||||||
|
Mean household income (per $10 000)† (N = 520) |
–0.031 (–0.051 to –0.012) |
0.002 |
–0.035 (–0.056 to –0.013) |
0.002 |
|||||||||||
|
Maternal education (N = 521) |
|
|
|
|
|||||||||||
|
Bachelor degree or higher |
Reference |
|
Reference |
|
|||||||||||
|
Year 12 or equivalent, diploma, apprenticeship or trade certificate |
0.11 (0.03 to 0.19) |
0.010 |
0.03 (–0.07 to 0.13) |
0.54 |
|||||||||||
|
Did not complete secondary education |
0.09 (–0.09 to 0.26) |
0.33 |
0.04 (–0.15 to 0.23) |
0.68 |
|||||||||||
|
Index of Relative Socio‐economic Disadvantage (N = 522) |
|
|
|
|
|||||||||||
|
Highest tertile (least disadvantaged) |
Reference |
|
Reference |
|
|||||||||||
|
Middle tertile |
0.14 (0.04 to 0.23) |
0.003 |
0.08 (–0.03 to 0.18) |
0.14 |
|||||||||||
|
Lowest tertile (most disadvantaged) |
0.08 (–0.01 to 0.19) |
0.08 |
–0.04 (–0.15 to 0.07) |
0.48 |
|||||||||||
|
Residential factors |
|
|
|
|
|||||||||||
|
Age of family home ≥ 50 years (N = 434) |
0.18 (0.08 to 0.27) |
< 0.001 |
0.13 (0.02 to 0.24) |
0.020 |
|||||||||||
|
Distance of home from Point Henry (N = 515) |
|
|
|
|
|||||||||||
|
> 10 km |
Reference |
|
Reference |
|
|||||||||||
|
5–10 km |
0.15 (0.07 to 0.23) |
< 0.001 |
0.11 (0.01 to 0.21) |
0.031 |
|||||||||||
|
< 5 km |
0.18 (–0.15 to 0.52) |
0.28 |
0.19 (–0.17 to 0.56) |
0.30 |
|||||||||||
|
|
|||||||||||||||
|
* Adjusted for mean household income (except “mean household income”), age of family home (except: “Age of family home ≥ 50 years”), distance of family home from Point Henry (except “distance of family home from Point Henry”). † Mean of household income during pregnancy and first year after child's birth, censored at $100 000. |
|||||||||||||||
Box 4 – Blood lead level at 4 years of age and distance of residence from Point Henry, adjusted for household income and age of home, with best fit curve (inverse square relationship)*
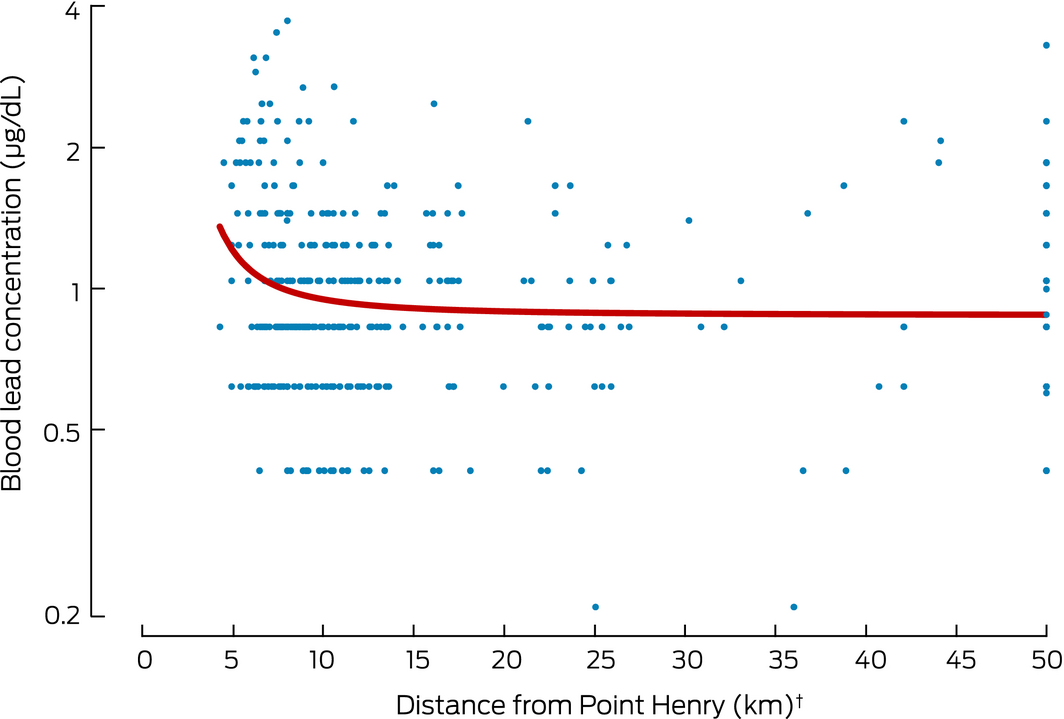
* For 428 children for whom data on lead levels, household income, and age of current home were available. † Censored at 50 km.
Box 5 – The effects of house‐ and child‐related factors on blood lead levels at 4 years of age in children who had lived at the same address for the 2‐ and 4‐year reviews, by age of family home*
|
Characteristic |
Mean difference (with 95% CI) in blood lead level (natural log units) |
||||||||||||||
|
Age of family home < 50 years |
Age of family home ≥ 50 years |
||||||||||||||
|
Number† |
Mean difference (95% CI) |
P |
Number† |
Mean difference (95% CI) |
P |
||||||||||
|
|
|||||||||||||||
|
House‐related factors |
|
|
|
|
|
|
|||||||||
|
Exterior: weatherboard (v other) |
8/150 |
–0.05 (–0.36 to 0.27) |
0.77 |
45/72 |
0.24 (–0.01 to 0.49) |
0.06 |
|||||||||
|
Flooring in child's bedroom: wall‐to‐wall carpet (v other) |
131/150 |
–0.20 (–0.41 to 0.01) |
0.06 |
44/72 |
–0.18 (–0.42 to 0.07) |
0.16 |
|||||||||
|
Flooring in main living room: wall‐to‐wall carpet (v other) |
75/150 |
–0.01 (–0.15 to 0.14) |
0.94 |
20/72 |
0.07 (–0.20 to 0.34) |
0.61 |
|||||||||
|
Renovations in past two years |
|
|
|
|
|
|
|||||||||
|
Major renovation (any room) |
20/208 |
–0.16 (–0.36 to 0.04) |
0.11 |
20/95 |
0.22 (–0.04 to 0.48) |
0.10 |
|||||||||
|
Any renovation of child's bedroom |
42/208 |
–0.03 (–0.17 to 0.12) |
0.72 |
22/94 |
0.23 (–0.02 to 0.48) |
0.07 |
|||||||||
|
Any renovation of living room |
48/209 |
–0.14 (–0.28 to –0.00) |
0.046 |
24/95 |
0.18 (–0.07 to 0.42) |
0.15 |
|||||||||
|
Any renovation of kitchen |
25/208 |
–0.14 (–0.32 to 0.04) |
0.13 |
23/95 |
0.07 (–0.18 to 0.33) |
0.56 |
|||||||||
|
Any renovation of parent bedroom |
26/208 |
–0.10 (–0.27 to 0.08) |
0.26 |
20/95 |
0.07 (–0.19 to 0.34) |
0.58 |
|||||||||
|
Any household pet at 4 years |
154/208 |
0.04 (–0.09 to 0.18) |
0.51 |
63/95 |
0.38 (0.17 to 0.60)‡ |
< 0.001 |
|||||||||
|
Child hand–mouth and hygiene behaviours |
|
|
|
|
|
|
|||||||||
|
Eats or drinks things that are not food§ |
12/175 |
–0.17 (–0.43 to 0.08) |
0.19 |
11/87 |
0.43 (0.12 to 0.75) |
0.007 |
|||||||||
|
Chews on things that are not edible§ |
59/175 |
0.02 (–0.11 to 0.16) |
0.73 |
33/87 |
0.13 (–0.10 to 0.35) |
0.26 |
|||||||||
|
Contact with sand most weeks |
95/199 |
0.02 (–0.10 to 0.14) |
0.69 |
47/90 |
0.33 (0.12 to 0.54) |
0.003 |
|||||||||
|
Contact with soil most weeks |
118/201 |
0.11 (–0.01 to 0.23) |
0.07 |
57/91 |
0.23 (–0.00 to 0.45) |
0.05 |
|||||||||
|
Bath or shower frequency (per category increase)¶ |
N = 208 |
0.00 (–0.11 to 0.10) |
0.92 |
N = 95 |
–0.21 (–0.40 to –0.03) |
0.026 |
|||||||||
|
Handwashing frequency (per category increase)** |
N = 208 |
0.00 (–0.09 to 0.09) |
0.98 |
N = 95 |
–0.02 (–0.18 to 0.14) |
0.80 |
|||||||||
|
|
|||||||||||||||
|
CI = confidence interval. * Total number of children: 307. As not all parents answered all questions, data are missing for some variables. † Number reporting factor/number for whom information for this category was available. ‡ Similar effect size for cat (23 of 95 children: mean difference, 0.17 natural log units; 95% CI, –0.07 to 0.42 natural log units) and dog ownership (45 of 95 children: mean difference, 0.17 natural log units; 95% CI, –0.05 to 0.38 natural log units). § Sometimes or often true v not true. ¶ Average of frequency categories reported at 2 and 4 years of age: hardly ever, once a week, several times a week but not every day, once a day, more than once a day. ** Average of frequency categories reported at 2 and 4 years of age: not at all, 1–2 times, 3–4 times, 5 or more times per day. |
|||||||||||||||
Received 21 March 2019, accepted 25 July 2019
- Christos Symeonides1,2
- Peter Vuillermin3,4
- Peter D Sly5,6
- Fiona Collier3,4
- Victoria Lynch7
- Sandra Falconer7
- Angela Pezic1
- Nicole Wardrop1
- Terence Dwyer1,8
- Sarath Ranganathan1,2
- Anne‐Louise B Ponsonby1,9
- 1 Murdoch Children's Research Institute, Melbourne, VIC
- 2 Royal Children's Hospital Melbourne, Melbourne, VIC
- 3 Barwon Health, Geelong, VIC
- 4 Deakin University, Geelong, VIC
- 5 Child Health Research Centre, University of Queensland, Brisbane, QLD
- 6 WHO Collaborating Centre for Children's Health and Environment, University of Queensland, Brisbane, QLD
- 7 Victoria Department of Health and Human Services, Melbourne, VIC
- 8 The George Institute for Global Health, University of Oxford, Oxford, United Kingdom
- 9 National Centre for Epidemiology and Population Health, Australian National University, Canberra, ACT
The Victorian Department of Health and Human Services contributed funding for the analysis of blood lead levels. The establishment and infrastructure for the Barwon Infant Study was funded by the Murdoch Children's Research Institute, Deakin University, and Barwon Health. Subsequent funding was provided by the National Health and Medical Research Council (NHMRC; grants APP607370, APP1009044, APP1029927, APP1024619, APP1030701, APP1076667, APP1147970); the Shepherd Foundation; the Jack Brockhoff Foundation; the Scobie Trust; the Shane O'Brien Memorial Asthma Foundation; the Our Women's Our Children's Fundraising Committee Barwon Health; the Rotary Club of Geelong; the Ilhan Food Allergy Foundation; Geelong Medical and Hospital Benefits Association; the Percy Baxter Charitable Trust; Perpetual Trustees; and Vanguard Investments Australia. In‐kind support was provided by the Cotton On Foundation and CreativeForce. Research at the Murdoch Children's Research Institute is supported by the Victorian Government through the Operational Infrastructure Support Program. Christos Symeonides is supported by an NHMRC Postgraduate Research Scholarship. Peter Vuillermin, Peter Sly and Anne‐Louise Ponsonby are supported by NHMRC Fellowships. The funding sources had no role in study design, data collection, analysis or interpretation, reporting or publication.
Victoria Lynch (principal advisor, environmental health policy and risk management) and Sandra Falconer (manager, environmental health policy and risk management) participated in this study as employees of the Victorian Department of Health and Human Services.
- 1. National Health and Medical Research Council. NHMRC Information paper. Evidence on the effects of lead on human health. Canberra: NHMRC, 2015. https://www.nhmrc.gov.au/sites/default/files/documents/reports/lead-human-health-info-paper-eh58a.pdf (viewed May 2019).
- 2. Gibson JL. A plea for painted railings and painted walls of rooms as the source of lead poisoning amongst Queensland children. Australasian Medical Gazette 1904; 23: 149–153; reprinted: Public Health Rep 2005; 120: 301‐304.
- 3. Turner AJ. On lead poisoning in childhood. Br Med J 1909; 1: 895.
- 4. Needleman HL, Leviton A. Lead and neurobehavioural deficit in children. Lancet 1979; 2: 104.
- 5. Bellinger DC, Stiles KM, Needleman HL. Low‐level lead exposure, intelligence and academic achievement: a long‐term follow‐up study. Pediatrics 1992; 90: 855–861.
- 6. Dietrich KN, Berger OG, Succop PA, et al. The developmental consequences of low to moderate prenatal and postnatal lead exposure: intellectual attainment in the Cincinnati Lead Study Cohort following school entry. Neurotoxicol Teratol 1993; 15: 37–44.
- 7. Baghurst PA, McMichael AJ, Wigg NR, et al. Environmental exposure to lead and children's intelligence at the age of seven years: the Port Pirie Cohort Study. N Engl J Med 1992; 327: 1279–1284.
- 8. Vimpani G, McMichael A, Robertson E, Wigg N. The Port Pirie Study: a prospective study of pregnancy outcome and early childhood growth and development in a lead‐exposed community: protocol and status report. Environ Res 1985; 38: 19–23.
- 9. Advisory Committee on Childhood Lead Poisoning Prevention (Centers for Disease Control and Prevention). Low level lead exposure harms children: a renewed call for primary prevention. Jan 2012. https://www.cdc.gov/nceh/lead/acclpp/final_document_030712.pdf (viewed May 2019).
- 10. Centers for Disease Control and Prevention. CDC response to Advisory Committee on Childhood Lead Poisoning Prevention recommendations in “Low level lead exposure harms children: a renewed call for primary prevention.” Updated 7 June 2012. https://www.cdc.gov/nceh/lead/acclpp/cdc_response_lead_exposure_recs.pdf (viewed May 2019).
- 11. Hopper J, Balderas A, Mathews JD. Analysis of variation in blood lead levels in Melbourne families. Med J Aust 1982; 2: 573–576.
- 12. Kelsall LM, de Gooyer TE, Carey M, et al. Blood lead levels in the adult Victorian population: results from the Victorian Health Monitor. Aust N Z J Public Health 2013; 37: 233–237.
- 13. US Department of Health and Human Services, Centres for Disease Control and Prevention. Fourth national report on human exposure to environmental chemicals. Updated tables, volume one. Jan 2019. https://www.cdc.gov/exposurereport/pdf/FourthReport_UpdatedTables_Volume1_Jan2019-508.pdf (viewed May 2019).
- 14. Mount Isa Lead Health Management Committee. The Lead Alliance: annual report 2017–2018. http://www.leadalliance.com.au/wp-content/uploads/2019/04/EYR-2017_18-FINAL.pdf (viewed May 2019).
- 15. Simon D, Zariff R, Bain P; Public Health Services. Port Pirie blood lead levels. Analysis of blood lead levels for the first nine months of 2018. Nov 2018. https://www.sahealth.sa.gov.au/wps/wcm/connect/public+content/sa+health+internet/resources/port+pirie+blood+lead+levels+analysis+1+january+-+30+september+2018 (viewed May 2019).
- 16. Guttinger R, Pascoe E, Rossi E, et al. The Fremantle lead study part 2. J Paediatr Child Health 2008; 44: 722–726.
- 17. Donovan J. Lead in Australian children: report on the National Survey of Lead in Children (Cat. No. AIHW 151). Canberra: Australian Institute of Health and Welfare, 1996. https://www.aihw.gov.au/reports/child-protection/liacr-on-the-national-survey-of-lead-in-children/contents/table-of-contents (viewed May 2019).
- 18. Vuillermin P, Saffery R, Allen KJ, et al. Cohort profile: the Barwon infant study. Int J Epidemiol 2015; 44: 1148–1160.
- 19. Australian Bureau of Statistics. 2033.0.55.00. Census of population and housing: Socio‐Economic Indexes for Areas (SEIFA): IRSD. Mar 2018. https://www.abs.gov.au/ausstats/abs@.nsf/Lookup/by%20Subject/2033.0.55.001~2016~Main%20Features~IRSD~19 (viewed May 2019).
- 20. Achenbach TM, Rescorla LA. Manual for the ASEBA preschool forms and profiles: an integrated system of multi‐informant assessment. Burlington (VT): University of Vermont, Research Center for Children, Youth, and Families, 2000.
- 21. Little RJ, Rubin DB. Statistical analysis with missing data. 2nd ed. Hoboken (NJ): John Wiley & Sons, 2002.
- 22. Osborne NJ, Ukoumunne OC, Wake M, Allen KJ. Prevalence of eczema and food allergy is associated with latitude in Australia. J Allergy Clin Immunol 2012; 129: 865–867.
- 23. Greenland S. Modeling and variable selection in epidemiologic analysis. Am J Public Health 1989; 79: 340–349.
- 24. Laidlaw MA, Taylor MP. Potential for childhood lead poisoning in the inner cities of Australia due to exposure to lead in soil dust. Environ Pollut 2011; 159: 1–9.
- 25. Gulson B, Mizon K, Taylor A, et al. Changes in manganese and lead in the environment and young children associated with the introduction of methylcyclopentadienyl manganese tricarbonyl in gasoline: preliminary results. Environ Res 2006; 100: 100–114.
- 26. National Health and Medical Research Council. Managing individual exposure to lead in Australia: a guide for health practitioners. Canberra: NHMRC, 2016. http://www.leadalliance.com.au/wp-content/uploads/2016/09/16200_nhmrc_managing_individual_exposure_to_lead_in_australia_web.pdf (viewed May 2019).
- 27. Tyrrell J, Melzer D, Henley W, et al. Associations between socioeconomic status and environmental toxicant concentrations in adults in the USA: NHANES 2001–2010. Environ Int 2013; 59: 328–335.
- 28. Dong C, Taylor MP, Zahran S. The effect of contemporary mine emissions on children's blood lead levels. Environ Int 2019; 122: 91–103.
Abstract
Objectives: To investigate blood lead levels in an Australian birth cohort of children; to identify factors associated with higher lead levels.
Design, setting: Cross‐sectional study within the Barwon Infant Study, a population birth cohort study in the Barwon region of Victoria (1074 infants, recruited June 2010 – June 2013). Data were adjusted for non‐participation and attrition by propensity weighting.
Participants: Blood lead was measured in 523 of 708 children appraised in the Barwon Infant Study pre‐school review (mean age, 4.2 years; SD, 0.3 years).
Main outcome measure: Blood lead concentration in whole blood (μg/dL).
Results: The median blood lead level was 0.8 μg/dL (range, 0.2–3.7 μg/dL); the geometric mean blood lead level after propensity weighting was 0.97 μg/dL (95% CI, 0.92–1.02 μg/dL). Children in houses 50 or more years old had higher blood lead levels (adjusted mean difference [AMD], 0.13 natural log units; 95% CI, 0.02–0.24 natural log units; P = 0.020), as did children of families with lower household income (per $10 000, AMD, –0.035 natural log units; 95% CI, –0.056 to –0.013 natural log units; P = 0.002) and those living closer to Point Henry (inverse square distance relationship; P = 0.002). Associations between hygiene factors and lead levels were evident only for children living in older homes.
Conclusion: Blood lead levels in our pre‐school children were lower than in previous Australian surveys and recent surveys in areas at risk of higher exposure, and no children had levels above 5 μg/dL. Our findings support advice to manage risks related to exposure to historical lead, especially in older houses.