


The known: Childhood cancer incidence rates were generally stable in Australia between 1994 and 2006.
The new: The overall incidence rate of childhood cancer increased by 1.2% per year between 2005 and 2015, and is expected to rise a further 7% over the next 20 years.
The implications: The causes of childhood cancers must be understood before interventions to reduce their incidence can be developed. Specialist health services for diagnosing and treating children with cancer need to be prepared to meet the expected growth in the number of cases.
The aetiology, biology, and clinical classification of childhood cancers differ from those of cancers diagnosed in adults.1,2 Childhood cancers are nevertheless usually either omitted from routine cancer statistics or included in those for the much more numerous adult cancers, obscuring implications specific to children. The Australian Institute of Health and Welfare has published cancer incidence projections for all age groups combined,3 but not separately for children.
Examining epidemiological patterns, including differences in incidence by country or over time, can provide important insights into the aetiology of childhood cancer by suggesting links with genetic or environmental factors.4 This is of particular importance for childhood cancers, given that their causes are typically unclear.5 Incidence projections can also provide insights into the future burden of cancer for guiding policy and health professionals responsible for ensuring that future demand for health services are met.
Previously published cancer incidence estimates and trends for children in Australia, for the period 1983–2006, were based on data from the Australian Childhood Cancer Registry (ACCR).6 The aims of our study were to examine whether the reported trends in incidence rates have persisted, and to specifically project — for the first time in Australia — the incidence of childhood cancers.
Methods
The ACCR maintains a database of all cancers diagnosed in Australia in children under 15 years of age. Australian state and territory population‐based cancer registries annually provide information to the ACCR on children with cancer registered in their jurisdiction. At the time of our study, complete national information was available for the period 1983–2015.
Childhood cancers are categorised into 12 diagnostic groups and 47 subgroups according to the International Classification of Childhood Cancers, 3rd edition (ICCC‐3).1 Intracranial and intraspinal tumours of benign or uncertain behaviour are included in the ICCC‐3 because their clinical symptoms and prognosis are similar to those of malignant tumours. As data on these tumours have historically not been collected consistently by all Australian state and territory cancer registries, cases of intracranial/intraspinal tumours of benign or uncertain behaviour were regularly ascertained directly in hospital records during site visits by the ACCR data manager.
Estimated resident population data by sex, age group, and year were obtained from the Australian Bureau of Statistics7 for incidence rate calculations, as were data on population forecasts.8 Intermediate population projections (series B), reflecting current trends in fertility, life expectancy at birth, and net migration from overseas,8 were used for our major analyses.
Incidence rates were calculated for the most recent five years of data (2011–2015) for all childhood cancers combined, and also stratified by sex, age group, diagnostic group, and major diagnostic subgroups. Rates were directly age‐standardised to the 2001 Australian standard population.9 For comparison, rates were also age‐standardised to the 2000 World Health Organization world standard population.10
Changes in incidence during 1983–2015 were examined in JoinPoint (United States National Cancer Institute; https://surveillance.cancer.gov/joinpoint). The Joinpoint model applies Monte Carlo permutation tests to detect significant changes in the magnitude or direction of trends;11 the year in which a change in trend is detected is termed a “joinpoint”. We fitted a maximum of two joinpoints to each of our data sets, allowing up to three distinct trend segments. We report incidence change in these segments as the annual percentage change (APC). An APC was deemed statistically significant if the corresponding 95% confidence interval (CI) did not include zero.
Incidence projections for all childhood cancers combined, as well as for the two largest diagnostic groups — leukaemias and tumours of the central nervous system (CNS) — were generated with the age‐period‐cohort method described by Mistry and colleagues.12 Specifically, Poisson regression models were applied using the Stata apcspline command, with counts as the dependent variable offset by the log of the corresponding population. Period and birth cohort effects (in single calendar years) were fitted with cubic splines.
Projected incidence counts and rates to 2035 (20 years beyond the baseline period) were extrapolated from these models. A damping parameter was specified to attenuate the projections, on the assumption that past trends will not continue indefinitely.13 In our major analyses, we applied an arbitrary damping factor of 16% per year, which conservatively reduced the observed linear trends for period and birth cohort effects (drift effects) by about 75% during the first 8 years of the forecast period. Sensitivity analyses applied alternative damping levels (8% or 25% per year), attenuating the drift effects by about 50% and 90% over 8 years respectively. In further sensitivity comparisons, projections were also calculated (with damping of 16%) using the high (series A) and low (series C) population projections.
Ethics approval
Ethics approval for the ACCR study was provided by the University of Queensland Behavioural and Social Sciences Ethical Review Committee (reference, 2004000302) and by the fifteen Human Research Ethics Committees of the state and territory cancer registries and major children's hospitals.
Results
A total of 20 547 children under the age of 15 years were diagnosed with cancer in Australia between 1983 and 2015. Overall data quality was very high: 19 270 cases (94%) were histologically verified.
Incidence, 2011–2015
For the most recent 5 years for which data were available, the mean annual number of children diagnosed with cancer was 770 (total for 5 years, 3851 children); the age‐standardised incidence rate was 174 cases per million children per year (Box 1). Age‐standardised rates calculated using the 2000 world standard population were very similar (Supporting Information, table 1).
The overall cancer incidence rate for boys (185 per million per year) was higher than for girls (163 per million per year). Of the 3851 childhood cancer cases diagnosed during 2011–2015, 1795 (47%) were diagnosed in children aged 0–4 years. The most frequently diagnosed cancer types were leukaemias (1199 cases, 31%; including 938 cases of lymphoid leukaemia), CNS tumours (961 cases, 25%), and lymphomas (397 cases, 10%) (Box 1).
Incidence rate trends, 1983–2015
The age‐standardised incidence rate of childhood cancer increased by 34% between 1983 and 2015. After increasing during 1983–1996 (APC, +1.6%; 95% CI, +1.1% to +2.1%), incidence stabilised during 1996–2005, but increased again between 2005 and 2015 (APC, +1.2%; 95% CI, +0.5% to +1.9%). During 2000–2015, the trend was similar for boys (APC, +0.8%; 95% CI, +0.3% to +1.3%) and girls (APC, +0.8%; 95% CI, +0.6% to +1.1%), but the trend was not as consistent across the entire period (1983–2015) for boys. Overall cancer incidence rates increased across the 33‐year period slowly but statistically significantly for children aged 0–4 (APC, +0.6%; 95% CI, +0.4% to +0.9%) and 5–9 years (APC, +0.7%; 95% CI, +0.4% to +1.0%), and more rapidly for children aged 10–14 years from 2005 (APC, +1.9%; 95% CI, +0.2% to +3.7%) (Box 2).
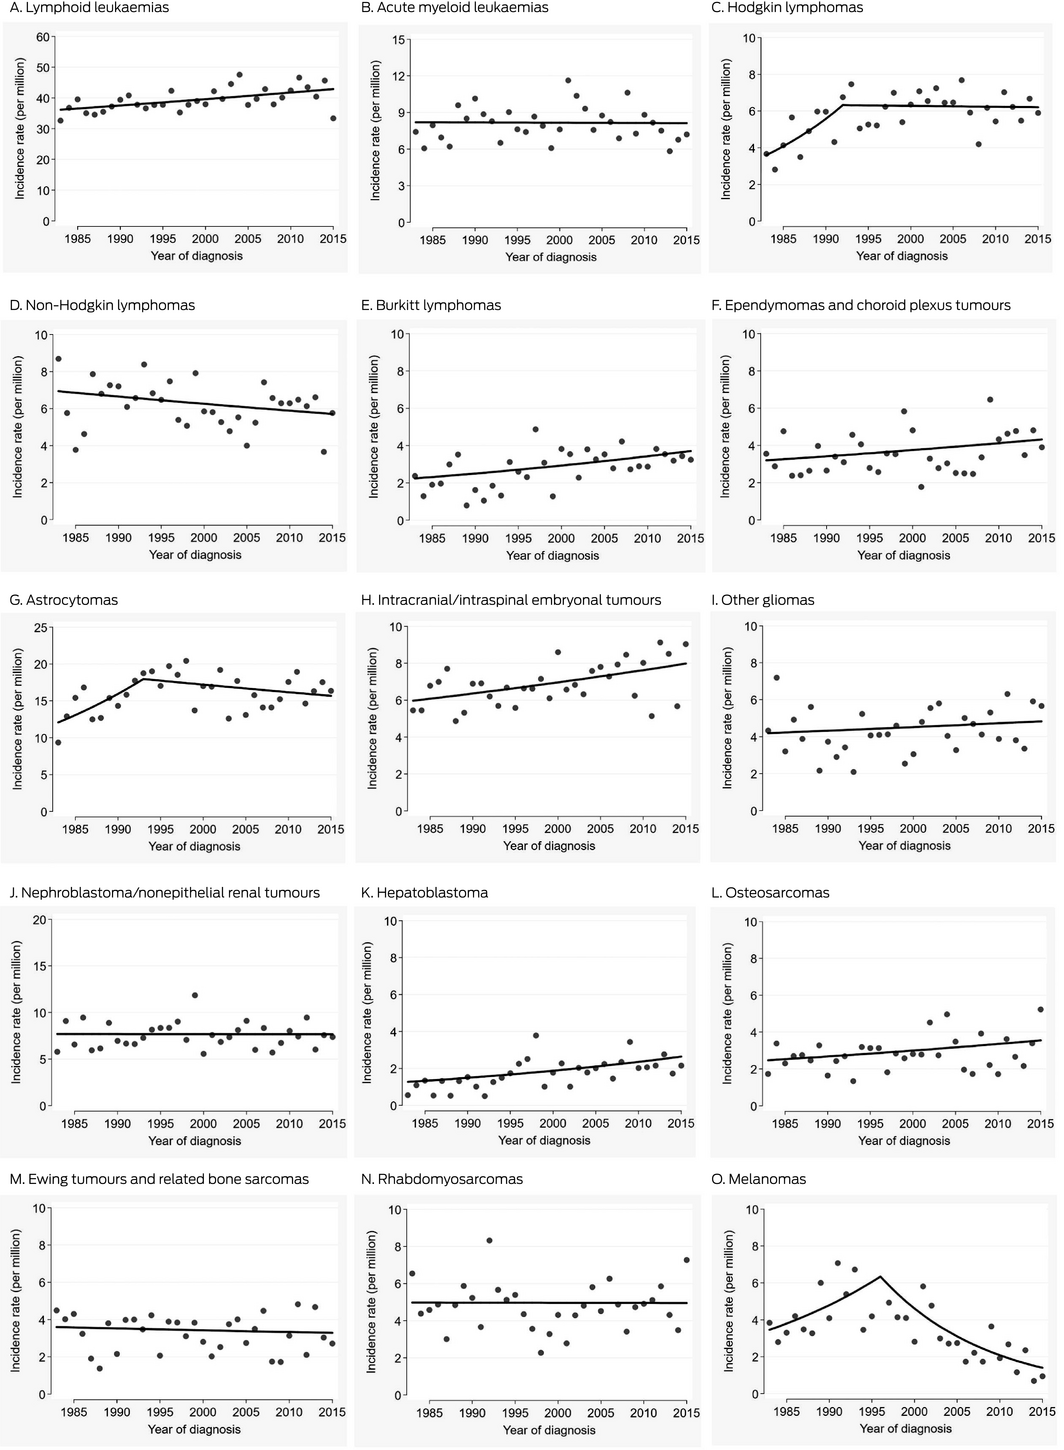
At the diagnostic group level, incidence rates increased significantly between 1983 and 2015 for hepatic tumours (APC, +2.4%; 95% CI, +0.9% to +3.8%), germ cell tumours (APC, +1.5%; 95% CI, +0.7% to +2.3%), lymphomas (APC, +0.9%; 95% CI, +0.5% to +1.3%), and leukaemias (APC, +0.6%; 95% CI, +0.3% to +0.9%) (Box 2). The incidence of CNS tumours increased significantly during 2005–2015 (APC, +3.3%; 95% CI, +1.6% to +5.1%); the proportion of CNS tumours classified as benign or of uncertain behaviour increased from 19% during 1983–1987 to 45% during 2011–2015 (data not shown). The incidence rate for the heterogeneous diagnostic group “other malignant epithelial neoplasms and melanomas” increased sharply during 2010–2015 (APC, +18.1%; 95% CI, +6.0% to +32%) (Box 2).
At the diagnostic subgroup level, incidence rates for hepatoblastoma (APC, +2.3%; 95% CI, +0.8% to +3.8%), Burkitt lymphomas (+1.6%; 95% CI, +0.4% to +2.8%), osteosarcomas (APC, +1.1%; 95% CI, +0.0 to +2.3%), intracranial and intraspinal embryonal tumours (APC, +0.9%; 95% CI, +0.4% to +1.5%), and lymphoid leukaemias (APC, +0.5%; 95% CI, +0.2 to +0.8%) each significantly increased across 1983–2015 (Box 3, Box 4). Melanoma was the only diagnostic subgroup for which there was a significant decline in incidence rates, from 1996 to 2015 (APC, –7.7%; 95% CI, –10% to –4.8%), reversing the significant increase between 1983 and 1996.
Incidence projections
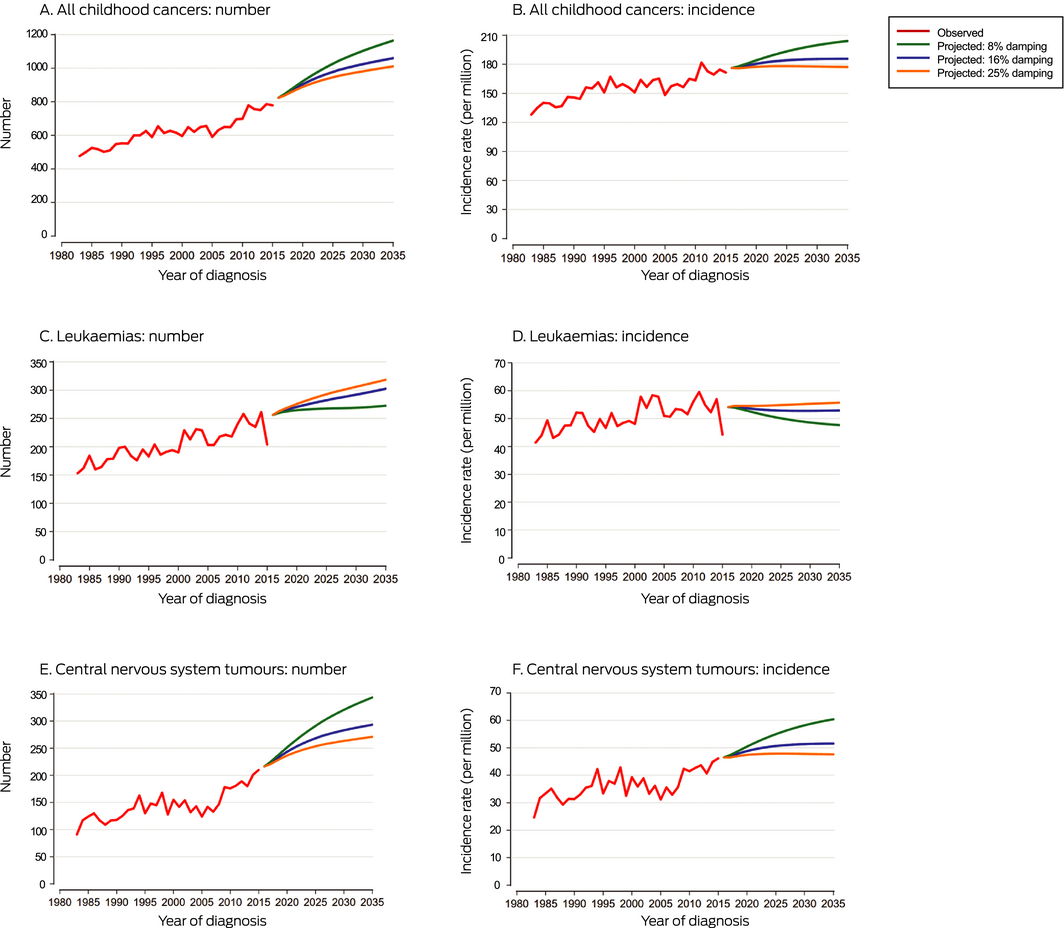
Applying a damping parameter of 16% per year, the number of childhood cancers diagnosed in Australia is projected to rise from a mean of 770 per year during 2011–2015 to 1060 per year by 2035, a 38% increase. This growth includes a projected 7% increase in the incidence rate of childhood cancers, from 174 cases (95% CI, 168–180 cases) per million children per year during 2011–2015 to 186 cases (95% CI, 175–197 cases) per million children per year in 2035. The predicted numbers of leukaemia (302) and CNS tumour cases (293) are similar by the end of the projection period, each accounting for an estimated 28% of all childhood cancers in 2035 (Box 5, Box 6).
Applying damping parameters of 8% or 25% respectively increased or reduced the rises in the projected incidence of childhood cancer diagnosed to 2035 (Box 5). With 8% damping, CNS tumours (344 of 1165 all projected childhood cancers, 30%) are projected to outnumber leukaemias (272, 23%) by 2035.
Varying the projected population series had a greater effect on the projected number of cancers than changing the damping parameter (noting that the projected incidence rates were similar). With 16% damping, the predicted total number of childhood cancers in 2035 ranged between 910 (18% increase on 2011–2015) with the low population series and 1219 (58% increase) with the high population series (Supporting Information, table 2).
Discussion
Following a period during which the overall incidence rate of childhood cancer was stable in Australia (1996–2005), it rose slowly but steadily over the following decade. Recent increases in overall childhood cancer incidence rates have also been reported in Asia14,15 and North America.16,17 The reasons for these increases are unclear, but diagnostic improvements and changes in reporting may be contributing factors.16
Our estimated incidence rate for childhood cancer in Australia is lower than those in Italy, the United States, and Canada, similar to rates in New Zealand and several European countries (Spain, Germany, France, Sweden, the Netherlands), but higher than in the United Kingdom, Japan, and the Republic of Korea.18 Comparisons between countries (and even within the same country over time) should be made cautiously, however, given differences in operational details, such as cancer registration methods and data quality, that may influence estimated incidence rates.18
Incidence rate trends for most types of childhood cancer in Australia were reasonably similar to those in our previous study,6 but there were some important changes. Most notably, the incidence of CNS tumours has increased sharply since 2005. This rise may be related to improved accuracy in diagnosing CNS tumours.19,20 The incidence rate of CNS tumours in children (0–19 years) in the United States was steady during 1998–2013, but changes in the incidence of specific subtypes were reported.21 It should be noted, however, that the US study was focused on malignant cancers (apart from non‐malignant pilocytic astrocytoma), whereas we included all intracranial and intraspinal tumours, including those of benign or uncertain behaviour, consistent with the ICCC‐3 definition.1 We found that the proportion of CNS tumours with benign or unknown behaviour has increased markedly in Australia since 1983.
The recent rise in the incidence of “other malignant epithelial neoplasms and melanoma” in Australia (despite the significant decline in rate for the melanoma subgroup) is probably attributable to changes in practice that have improved the detection of certain epithelial cancers; in particular, the histopathology of appendectomy specimens is now routinely assessed, incidentally increasing the identification of carcinoid tumours of the appendix.
We have conservatively estimated that the annual number of children diagnosed with cancer in Australia will grow by almost 40% over the next 20 years, taking into account current cancer incidence rate trends and population growth. This information is critical for the planning of health services, including estimating the number of beds required in paediatric oncology treatment facilities and drug costs, workforce planning, and ongoing surveillance and treatment of late effects among the ever increasing number of children who survive cancer.
It has been projected that the number of children diagnosed with incident cancer worldwide will increase from 397 000 in 2015 to about 431 000 per year by 2030.22 The number is expected to decline or to remain stable in most regions, but population growth will drive up the number of cases in Africa.22 It should be noted that registration of non‐malignant CNS tumours varied between registries contributing to the dataset18 used in this global study, so that incidence may have been underestimated with respect to ICCC‐3 definitions. For example, the authors of the global report estimated that the number of incident childhood cancers in Australia during 2015 was 67322, but 779 cases were recorded in the Australian Childhood Cancer Registry.
Strengths and limitations
We analysed high quality data for a large, population‐based cohort. Nevertheless, assumptions in the modelling process are subject to uncertainties that are magnified when making predictions over an extended period of time. We therefore applied a damping factor of 16% (rather than the default 8%) when modelling future incidence to reduce the impact on our projections of future changes in the direction or magnitude of incidence rate trends. This approach averted overestimating the future number of childhood cancers; in particular, the rapid rise in the incidence of CNS tumours since 2005 seems unlikely to continue indefinitely. Nonetheless, the projections for specific cancer types (leukaemias and CNS tumours) are less robust than those for all childhood cancers combined because of the smaller numbers of cases, and should be interpreted with due caution. Our sensitivity analyses illustrated how projections varied according to assumptions regarding the damping factor and population growth. The projected rise in the number of cancers between 2011–2015 and 2035 was found to be more sensitive to choice of population series (range with 16% damping, 18–58%) than to damping (range with intermediate population series, 31–51%).
Conclusion
The overall incidence rate of childhood cancer is slowly increasing after a ten‐year period during which it was stable. This finding is consistent with reports from other countries, raising questions about the reasons for the increasing rates. Greater investment in research into the aetiology of childhood cancers is required, particularly to identify modifiable risk factors. Our conservative estimates of the future burden of cancer in Australian children may inform health service planning, ensuring that our youngest cancer patients continue to receive the treatment and support they need.
Box 1 – Mean annual numbers and incidence rates of childhood cancers by sex, age group, and diagnostic group/subgroup, Australia, 2011–2015
|
|
Mean annual number of cases |
Incidence rate (per million population per year)*(95% CI) |
|||||||||||||
|
|
|||||||||||||||
|
All childhood cancers combined |
770 |
174 (168–180) |
|||||||||||||
|
Sex |
|
|
|||||||||||||
|
Boys |
420 (54.5%) |
185 (177–193) |
|||||||||||||
|
Girls |
350 (45.5%) |
163 (155–170) |
|||||||||||||
|
Age group at diagnosis |
|
|
|||||||||||||
|
0–4 years |
359 (46.6%) |
237 (226–248) |
|||||||||||||
|
5–9 years |
203 (26.3%) |
139 (130–148) |
|||||||||||||
|
10–14 years |
208 (27.1%) |
149 (140–158) |
|||||||||||||
|
Diagnostic group/subgroup† |
|
|
|||||||||||||
|
I. Leukaemias, myeloproliferative and myelodysplastic diseases |
240 (31.1%) |
53.5 (50.5–56.6) |
|||||||||||||
|
Ia. Lymphoid leukaemias |
188 (24.4%) |
42.5 (39.8–45.3) |
|||||||||||||
|
Ib. Acute myeloid leukaemias |
31.6 (4.1%) |
7.2 (6.1–8.4) |
|||||||||||||
|
II. Lymphomas and reticuloendothelial neoplasms |
79.4 (10.3%) |
18.5 (16.7–20.4) |
|||||||||||||
|
IIa. Hodgkin lymphomas |
26.2 (3.4%) |
6.3 (5.3–7.5) |
|||||||||||||
|
IIb. Non‐Hodgkin lymphomas (other than Burkitt lymphomas) |
24.4 (3.2%) |
5.8 (4.8–6.9) |
|||||||||||||
|
IIc. Burkitt lymphomas |
15.0 (1.9%) |
3.5 (2.8–4.4) |
|||||||||||||
|
III. Central nervous system and intracranial/intraspinal neoplasms‡ |
192 (25.0%) |
43.7 (40.9–46.5) |
|||||||||||||
|
IIIa. Ependymomas and choroid plexus tumours |
19.4 (2.5%) |
4.4 (3.6–5.4) |
|||||||||||||
|
IIIb. Astrocytomas |
73.2 (9.5%) |
17.0 (15.3–18.8) |
|||||||||||||
|
IIIc. Intracranial and intraspinal embryonal tumours |
33.4 (4.3%) |
7.6 (6.5–8.9) |
|||||||||||||
|
IIId. Other gliomas |
22.0 (2.9%) |
5.1 (4.2–6.1) |
|||||||||||||
|
IV. Neuroblastoma and other peripheral nervous cell tumours |
45.8 (5.9%) |
9.9 (8.6–11.2) |
|||||||||||||
|
V. Retinoblastoma |
20.0 (2.6%) |
4.3 (3.5–5.2) |
|||||||||||||
|
VI. Renal tumours |
36.2 (4.7%) |
7.8 (6.7–9.1) |
|||||||||||||
|
VIa. Nephroblastoma and other non‐epithelial renal tumours |
35.0 (4.5%) |
7.7 (6.6–8.9) |
|||||||||||||
|
VII. Hepatic tumours |
11.6 (1.5%) |
2.6 (1.9–3.3) |
|||||||||||||
|
VIIa. Hepatoblastoma |
10.0 (1.3%) |
2.2 (1.6–2.9) |
|||||||||||||
|
VIII. Malignant bone tumours |
30.6 (4.0%) |
7.3 (6.2–8.5) |
|||||||||||||
|
VIIIa. Osteosarcomas |
14.2 (1.8%) |
3.4 (2.7–4.3) |
|||||||||||||
|
VIIIc. Ewing tumours and related bone sarcomas |
14.8 (1.9%) |
3.5 (2.7–4.4) |
|||||||||||||
|
IX. Soft tissue and other extra‐osseous sarcomas |
46.4 (6.0%) |
10.6 (9.2–12.0) |
|||||||||||||
|
IXa. Rhabdomyosarcomas |
23.2 (3.0%) |
5.3 (4.4–6.3) |
|||||||||||||
|
X. Germ cell tumours,‡ trophoblastic tumours, and neoplasms of gonads |
27.0 (3.5%) |
6.2 (5.2–7.3) |
|||||||||||||
|
XI. Other malignant epithelial neoplasms and melanomas |
38.2 (5.0%) |
9.2 (7.9–10.5) |
|||||||||||||
|
XId. Melanomas |
6.6 (0.9%) |
1.6 (1.1–2.2) |
|||||||||||||
|
XII. Other and unspecified malignant neoplasms |
3.0 (0.4%) |
0.7 (0.4–1.1) |
|||||||||||||
|
|
|||||||||||||||
|
CI = confidence interval. * Age‐standardised to the 2001 Australian standard population.9 † Defined according to the International Classification of Childhood Cancers (ICCC‐3).1 ‡ Includes intracranial and intraspinal tumours of benign or uncertain behaviour. |
|||||||||||||||
Box 2 – Changes in incidence rate trends for childhood cancers by sex, age group, and diagnostic group, Australia, 1983–2015*
|
|
Total number of cases |
Trend period 1† |
Trend period 2† |
Trend period 3† |
|||||||||||
|
Period |
APC (95% CI) |
Period |
APC (95% CI) |
Period |
APC (95% CI) |
||||||||||
|
|
|||||||||||||||
|
All childhood cancers |
20 547 |
1983–1996 |
+1.6% |
1996–2005 |
–0.3% |
2005‐2015 |
+1.2% |
||||||||
|
Sex |
|
|
|
|
|
|
|
||||||||
|
Boys |
11 327 |
1983–1994 |
+1.9% |
1994–2000 |
–0.9% |
2000–2015 |
+0.8% |
||||||||
|
Girls |
9220 |
1983–2015 |
+0.8% |
— |
— |
— |
— |
||||||||
|
Age group at diagnosis |
|
|
|
|
|
|
|
||||||||
|
0–4 years |
9576 |
1983–2015 |
+0.6% |
— |
— |
— |
— |
||||||||
|
5–9 years |
5185 |
1983–2015 |
+0.7% |
— |
— |
— |
— |
||||||||
|
10–14 years |
5786 |
1983–1996 |
+2.9% |
1996–2005 |
–1.4% |
2005–2015 |
+1.9% |
||||||||
|
Diagnostic group‡ |
|
|
|
|
|
|
|
||||||||
|
I. Leukaemias, myeloproliferative and myelodysplastic diseases |
6685 |
1983–2015 |
+0.6% |
— |
— |
— |
— |
||||||||
|
II. Lymphomas and reticuloendothelial neoplasms |
2041 |
1983–2015 |
+0.9% |
— |
— |
— |
— |
||||||||
|
III. Central nervous system and intracranial/intraspinal neoplasms§ |
4792 |
1983–1998 |
+2.0% |
1998–2005 |
–2.2% |
2005–2015 |
+3.3% |
||||||||
|
IV. Neuroblastoma and other peripheral nervous cell tumours |
1295 |
1983–2015 |
+0.3% |
— |
— |
— |
— |
||||||||
|
V. Retinoblastoma |
530 |
1983–2015 |
+0.5% |
— |
— |
— |
— |
||||||||
|
VI. Renal tumours |
1046 |
1983–2015 |
+0.1% |
— |
— |
— |
— |
||||||||
|
VII. Hepatic tumours |
276 |
1983–2015 |
+2.4% |
— |
— |
— |
— |
||||||||
|
VIII. Malignant bone tumours |
848 |
1983–2015 |
+0.3% |
— |
— |
— |
— |
||||||||
|
IX. Soft tissue and other extra‐osseous sarcomas |
1221 |
1983–2015 |
+0.4% |
— |
— |
— |
— |
||||||||
|
X. Germ cell tumours,§ trophoblastic tumours and neoplasms of gonads |
768 |
1983–2015 |
+1.5% |
— |
— |
— |
— |
||||||||
|
XI. Other malignant epithelial neoplasms and melanomas |
989 |
1983–1996 |
+4.0% |
1996–2010 |
–4.3% |
2010–2015 |
+18% |
||||||||
|
|
|||||||||||||||
|
APC = annual percentage change; CI = confidence interval. * Age‐standardised to the 2001 Australian Standard Population.9 † Trends calculated by joinpoint analysis. A joinpoint is the year in which there is a significant change in the magnitude or direction of the modelled trend. A maximum of two joinpoints (ie, three trend lines) were fitted. The number and location of the joinpoints differed by cancer type. ‡ Defined according to the International Classification of Childhood Cancers (ICCC‐3).1 § Includes intracranial and intraspinal tumours of benign or uncertain behaviour. |
|||||||||||||||
Box 4 – Changes in incidence rate trends for childhood cancers by diagnostic subgroup, Australia, 1983–2015*
|
Diagnostic group/subgroup‡ |
Trend period 1† |
Trend period 2† |
|||||||||||||
|
Period |
APC (95% CI) |
Period |
APC (95% CI) |
||||||||||||
|
|
|||||||||||||||
|
I. Leukaemias, myeloproliferative and myelodysplastic diseases |
|
|
|
|
|||||||||||
|
Ia. Lymphoid leukaemias |
1983–2015 |
+0.5% (+0.2% to +0.8%) |
|
|
|||||||||||
|
Ib. Acute myeloid leukaemias |
1983–2015 |
0.0% (–0.7% to +0.6%) |
|
|
|||||||||||
|
II. Lymphomas and reticuloendothelial neoplasms |
|
|
|
|
|||||||||||
|
IIa. Hodgkin lymphomas |
1983–1992 |
+6.5% (+1.2% to +12%) |
1992–2015 |
–0.1% (–1.1% to +0.9%) |
|||||||||||
|
IIb. Non‐Hodgkin lymphomas (other than Burkitt lymphomas) |
1983–2015 |
–0.6% (–1.3% to +0.1%) |
|
|
|||||||||||
|
IIc. Burkitt lymphomas |
1983–2015 |
+1.6% (+0.4% to +2.8%) |
|
|
|||||||||||
|
III. Central nervous system and intracranial/intraspinal neoplasms§ |
|
|
|
|
|||||||||||
|
IIIa. Ependymomas and choroid plexus tumours |
1983–2015 |
+0.9% (–0.1% to +2.0%) |
|
|
|||||||||||
|
IIIb. Astrocytomas |
1983–1993 |
+4.0% (+0.7% to +7.5%) |
1993–2015 |
–0.6% (–1.5% to +0.2%) |
|||||||||||
|
IIIc. Intracranial and intraspinal embryonal tumours |
1983–2015 |
+0.9% (+0.4% to +1.5%) |
|
|
|||||||||||
|
IIId. Other gliomas |
1983–2015 |
+0.4% (–0.5% to +1.4%) |
|
|
|||||||||||
|
VI. Renal tumours |
|
|
|
|
|||||||||||
|
VIa. Nephroblastoma and other non‐epithelial renal tumours |
1983–2015 |
0.0% (–0.7% to +0.7%) |
|
|
|||||||||||
|
VII. Hepatic tumours |
|
|
|
|
|||||||||||
|
VIIa. Hepatoblastoma |
1983–2015 |
+2.3% (+0.8% to +3.8%) |
|
|
|||||||||||
|
VIII. Malignant bone tumours |
|
|
|
|
|||||||||||
|
VIIIa. Osteosarcomas |
1983–2015 |
+1.1% (+0.0% to +2.3%) |
|
|
|||||||||||
|
VIIIc. Ewing tumours and related bone sarcomas |
1983–2015 |
–0.3% (–1.3% to +0.8%) |
|
|
|||||||||||
|
IX. Soft tissue and other extra‐osseous sarcomas |
|
|
|
|
|||||||||||
|
IXa. Rhabdomyosarcomas |
1983–2015 |
–0.0% (–1.0% to +0.9%) |
|
|
|||||||||||
|
XI. Other malignant epithelial neoplasms and melanomas |
|
|
|
|
|||||||||||
|
XId. Melanomas |
1983–1996 |
+4.8% (+0.4% to +9.3%) |
1996–2015 |
–7.7% (–10% to –4.8%) |
|||||||||||
|
|
|||||||||||||||
|
APC = annual percentage change; CI = confidence interval. * Age‐standardised to the 2001 Australian Standard Population.9 † Trends calculated by joinpoint analysis. A joinpoint is the year in which there is a significant change in the magnitude or direction of the modelled trend. A maximum of two joinpoints (ie, three trend lines) were fitted. The number and location of the joinpoints differed by cancer type. ‡ Defined according to the International Classification of Childhood Cancers (ICCC‐3).1 § Includes intracranial and intraspinal tumours of benign or uncertain behaviour. |
|||||||||||||||
Box 5 – Baseline (2011–2015) and projected (to 2035) numbers of cases and incidence rates of childhood cancer in Australia
|
Diagnostic group* |
8% annual damping |
16% annual damping |
25% annual damping |
||||||||||||
|
Number of cases |
Incidence rate, per million population† |
Number of cases |
Incidence rate, per million population† |
Number of cases |
Incidence rate, per million population† |
||||||||||
|
|
|||||||||||||||
|
Annual mean, 2011–2015 (baseline) |
|
|
|
|
|
|
|||||||||
|
All childhood cancers |
770 |
174 (168–180) |
770 |
174 (168–180) |
770 |
174 (168–180) |
|||||||||
|
Leukaemias |
240 |
53 (51–57) |
240 |
53 (51–57) |
240 |
53 (51–57) |
|||||||||
|
Central nervous system tumours‡ |
192 |
44 (41–47) |
192 |
44 (41–47) |
192 |
44 (41–47) |
|||||||||
|
Projected, by year |
|
|
|
|
|
|
|||||||||
|
2020 |
|
|
|
|
|
|
|||||||||
|
All childhood cancers |
922 |
184 (172–196) |
904 |
181 (169–193) |
889 |
177 (166–190) |
|||||||||
|
Leukaemias§,¶ |
265 |
52 (46–59) |
270 |
54 (47–60) |
275 |
55 (48–61) |
|||||||||
|
Central nervous system tumours‡,¶ |
252 |
50 (44–57) |
243 |
49 (43–55) |
236 |
47 (42–54) |
|||||||||
|
2025 |
|
|
|
|
|
|
|||||||||
|
All childhood cancers |
1026 |
193 (182–206) |
978 |
184 (173–196) |
946 |
178 (167–190) |
|||||||||
|
Leukaemias§,¶ |
267 |
50 (44–56) |
282 |
53 (47–59) |
293 |
55 (49–62) |
|||||||||
|
Central nervous system tumours‡,¶ |
291 |
55 (49–62) |
268 |
51 (45–57) |
253 |
48 (42–54) |
|||||||||
|
2030 |
|
|
|
|
|
|
|||||||||
|
All childhood cancers |
1103 |
200 (188–212) |
1024 |
185 (174–197) |
982 |
178 (167–189) |
|||||||||
|
Leukaemias§,¶ |
269 |
49 (43–55) |
292 |
53 (47–59) |
306 |
55 (49–62) |
|||||||||
|
Central nervous system tumours‡,¶ |
321 |
58 (52–65) |
283 |
51 (46–58) |
263 |
48 (42–54) |
|||||||||
|
2035 |
|
|
|
|
|
|
|||||||||
|
All childhood cancers |
1165 |
204 (193–216) |
1060 |
186 (175–197) |
1012 |
177 (167–189) |
|||||||||
|
Leukaemias§,¶ |
272 |
48 (42–54) |
302 |
53 (47–59) |
318 |
56 (50–62) |
|||||||||
|
Central nervous system tumours‡,¶ |
344 |
60 (54–67) |
293 |
52 (46–58) |
271 |
48 (42–54) |
|||||||||
|
|
|||||||||||||||
|
CI = confidence interval. * Defined according to International Classification of Childhood Cancers (ICCC‐3).1 † Age‐standardised to the 2001 Australian standard population; confidence interval relates to age‐standardisation process only.9 ‡ Includes intracranial and intraspinal tumours of benign or uncertain behaviour. § As case numbers and rates for leukaemia had begun to decline just before the end of the baseline period, the effect of increased damping is to reduce the projected decline. ¶ The projections for specific cancer types (leukaemias and CNS tumours) are less robust than those for all childhood cancers combined because of the smaller numbers of cases and should be interpreted with due caution. |
|||||||||||||||
Received 11 March 2019, accepted 17 July 2019
- Danny R Youlden1,2
- Peter D Baade1,2,3
- Adèle C Green4,5
- Patricia C Valery4
- Andrew S Moore6,7
- Joanne F Aitken1,2,8,9
- 1 Cancer Council Queensland, Brisbane, QLD
- 2 Menzies Health Institute Queensland, Griffith University, Gold Coast, QLD
- 3 Queensland University of Technology, Brisbane, QLD
- 4 QIMR Berghofer Medical Research Institute, Brisbane, QLD
- 5 Cancer Research UK Manchester Institute, Manchester University, Manchester, United Kingdom
- 6 Children's Health, Queensland Hospital and Health Service, Brisbane, QLD
- 7 Child Health Research Centre, University of Queensland, Brisbane, QLD
- 8 Institute for Resilient Regions, University of Southern Queensland, Brisbane, QLD
- 9 University of Queensland, Brisbane, QLD
Patricia Valery was supported by an NHMRC Career Development Fellowship (1083090). We thank Leisa O'Neill for her work in the Australian Childhood Cancer Registry. We also acknowledge the assistance of all Australian state and territory cancer registries, the Australian Institute of Health and Welfare, and each of the major paediatric oncology treating hospitals throughout Australia.
No relevant disclosures.
- 1. Steliarova‐Foucher E, Stiller C, Lacour B, Kaatsch P. International Classification of Childhood Cancer, third edition. Cancer 2005; 103: 1457–1467.
- 2. Smith MA, Reaman GH. Remaining challenges in childhood cancer and newer targeted therapeutics. Pediatr Clin North Am 2015; 62: 301–312.
- 3. Australian Institute of Health and Welfare. Cancer incidence projections: Australia, 2011 to 2020 (Cat. no. CAN 62; Cancer series no. 66). Canberra: AIHW, 2012.
- 4. Rodriguez‐Galindo C, Friedrich P, Alcasabas P, et al. Toward the cure of all children with cancer through collaborative efforts: pediatric oncology as a global challenge. J Clin Oncol 2015; 33: 3065–3073.
- 5. Spector LG, Pankratz N, Marcotte EL. Genetic and nongenetic risk factors for childhood cancer. Pediatr Clin North Am 2015; 62: 11–25.
- 6. Baade PD, Youlden DR, Valery PC, et al. Trends in incidence of childhood cancer in Australia, 1983–2006. Br J Cancer 2010; 102: 620–626.
- 7. Australian Bureau of Statistics. 3101.0. Australian demographic statistics, Jun 2017. Dec 2017. https://www.abs.gov.au/AUSSTATS/abs@.nsf/DetailsPage/3101.0Jun%202017?OpenDocument (viewed Nov 2018).
- 8. Australian Bureau of Statistics. 3222.0. Population projections Australia: 2012 (base) to 2101. Nov 2013. https://www.abs.gov.au/AUSSTATS/abs@.nsf/DetailsPage/3222.02012%20(base)%20to%202101?OpenDocument (viewed Nov 2018).
- 9. Australian Bureau of Statistics. 3101.0. Australian demographic statistics, Sep 2002 (2001 census edition, final). Mar 2003. https://www.abs.gov.au/AUSSTATS/abs@.nsf/DetailsPage/3101.0Sep%202002?OpenDocument (viewed Nov 2018).
- 10. Ahmad OB, Boschi‐Pinto C, Lopez AD, et al. Age standardization of rates: a new WHO standard (GPE Discussion Paper Series, No. 31). Geneva: World Health Organization, 2001. https://www.who.int/healthinfo/paper31.pdf (viewed Oct 2019).
- 11. Kim H, Fay M, Feuer E, Midthune D. Permutation tests for joinpoint regression with applications to cancer rates. Stat Med 2000; 19: 335–351.
- 12. Mistry M, Parkin DM, Ahmad AS, Sasieni P. Cancer incidence in the United Kingdom: projections to the year 2030. Br J Cancer 2011; 105: 1795–1803.
- 13. Møller B, Fekjaer H, Hakulinen T, et al. Prediction of cancer incidence in the Nordic countries up to the year 2020. Eur J Cancer Prev 2002; 11 Suppl 1: S1–S96.
- 14. Zheng R, Peng X, Zeng H, et al. Incidence, mortality and survival of childhood cancer in China during 2000–2010 period: a population‐based study. Cancer Lett 2015; 363: 176–180.
- 15. Liu YL, Lo WC, Chiang CJ, et al. Incidence of cancer in children aged 0–14 years in Taiwan, 1996–2010. Cancer Epidemiol 2015; 39: 21–28.
- 16. Lewis DR, Chen HS, Cockburn MG, et al. Early estimates of SEER cancer incidence, 2014. Cancer 2017; 123: 2524–2534.
- 17. Xie L, Onysko J, Morrison H. Childhood cancer incidence in Canada: demographic and geographic variation of temporal trends (1992–2010). Health Promot Chronic Dis Prev Can 2018; 38: 79–115.
- 18. Steliarova‐Foucher E, Colombet MR, Ries LAG, et al, editors. International incidence of childhood cancer, volume III (electronic version). Lyon: International Agency for Research on Cancer, 2017. http://iicc.iarc.fr/results (viewed Apr 2018).
- 19. Lequin M, Hendrikse J. Advanced MR imaging in pediatric brain tumors, clinical applications. Neuroimaging Clin N Am 2017; 27: 167–190.
- 20. Segal D, Karajannis MA. Pediatric brain tumors: an update. Curr Probl Pediatr Adolesc Health Care 2016; 46: 242–250.
- 21. Withrow DR, de Gonzalez AB, Lam CJK, et al. Trends in pediatric central nervous system tumor incidence in the United States, 1998–2013. Cancer Epidemiol Biomarkers Prev 2018; 28: 522–530.
- 22. Ward Z, Yeh J, Bhakta N, et al. Estimating the total incidence of global childhood cancer: a simulation‐based analysis. Lancet Oncol 2019; 20: 483–493.
Abstract
Objectives: To describe changes in childhood cancer incidence in Australia, 1983–2015, and to estimate projected incidence to 2035.
Design, setting: Population‐based study; analysis of Australian Childhood Cancer Registry data for the 20 547 children under 15 years of age diagnosed with cancer in Australia between 1983 and 2015.
Main outcome measures: Incidence rate changes during 1983–2015 were assessed by joinpoint regression, with rates age‐standardised to the 2001 Australian standard population. Incidence projections to 2035 were estimated by age‐period‐cohort modelling.
Results: The overall age‐standardised incidence rate of childhood cancer increased by 34% between 1983 and 2015, increasing by 1.2% (95% CI, +0.5% to +1.9%) per annum between 2005 and 2015. During 2011–2015, the mean annual number of children diagnosed with cancer in Australia was 770, an incidence rate of 174 cases (95% CI, 169–180 cases) per million children per year. The incidence of hepatoblastoma (annual percentage change [APC], +2.3%; 95% CI, +0.8% to +3.8%), Burkitt lymphoma (APC, +1.6%; 95% CI, +0.4% to +2.8%), osteosarcoma (APC, +1.1%; 95%, +0.0% to +2.3%), intracranial and intraspinal embryonal tumours (APC, +0.9%; 95% CI, +0.4% to +1.5%), and lymphoid leukaemia (APC, +0.5%; 95% CI, +0.2% to +0.8%) increased significantly across the period 1983–2015. The incidence rate of childhood melanoma fell sharply between 1996 and 2015 (APC, –7.7%; 95% CI, –10% to –4.8%). The overall annual cancer incidence rate is conservatively projected to rise to about 186 cases (95% CI, 175–197 cases) per million children by 2035 (1060 cases per year).
Conclusions: The incidence rates of several childhood cancer types steadily increased during 1983–2015. Although the reasons for these rises are largely unknown, our findings provide a foundation for health service planning for meeting the needs of children who will be diagnosed with cancer until 2035.