


The known: From 1981 to 2003, life expectancy at birth increased more rapidly in Australia than in most other high income countries.
The new: The main contributor to greater increases in life expectancy in Australia from 1980 was lower mortality from ischaemic heart disease. Since 2003, life expectancy has increased more slowly than in most high income countries, primarily because the declines in mortality from cardiovascular disease and cancer have slowed.
The implications: Slower declines in disease‐specific mortality, higher prevalence of obesity, and less scope for further reducing smoking mean that life expectancy will probably increase more slowly than in other high income countries.
After the Second World War, the prevalence of non‐communicable diseases increased considerably in Australia for several decades. During 1950–1970, tobacco‐related diseases (ischaemic heart disease, cerebrovascular diseases, chronic respiratory diseases, lung cancer) increased the mortality risk among men aged 50–80 years (source: Institute of Health Metrics and Evaluation, University of Washington, Sept 2018). In 1970, the mortality among Australian males attributed to ischaemic heart disease was second in the industrialised world only to that of Finland.1 For younger men, road traffic accident‐related mortality was also substantial. Despite falling infant and child mortality, the increased adult mortality risk meant that life expectancy at birth increased between 1950 and 1970 by only 0.9 years for men and 2.5 years for women (source: Institute of Health Metrics and Evaluation, University of Washington, Sept 2018).
After 1970, however, Australian life expectancy improved markedly, comparing favourably with that of other high income countries.2 Clear declines in mortality from specific causes, especially among men, have been attributed to public health interventions, including those for reducing tobacco smoking and improving road safety.3,4,5 By the year 2000, life expectancy at birth for Australians was among the highest in the world.2
Since the early 2000s, however, life expectancy at birth in Australia has increased relatively slowly.2 Given the slowing of the decline in mortality from coronary heart disease among young and middle‐aged adults, and the increased prevalence of risk factors such as obesity and opioid use,6,7,8,9 the high international ranking of life expectancy in Australia may be short‐lived.
Understanding the extent and causes of changes that underlie the slowing of the increase in life expectancy is important for public policy, as is comparing them with changes in other high income countries. We therefore compared life expectancy at birth in Australia during 1980–2016 with life expectancy in other high income countries, and also specifically with life expectancy in western Europe and the United States. We estimated the contributions of age at death and cause of death to differences between Australia and these countries. Finally, we discuss changes in life expectancy in Australia in the context of shifts in the prevalence of risk factors, as well as the future of mortality in Australia and other high income countries, seeking to identify priorities for public health responses.
Methods
Deaths by age, sex and cause, and population numbers by age and sex were calculated by the Institute of Health Metrics and Evaluation, University of Washington, from data compiled for the Global Burden of Disease (GBD) Study.2,10 We analysed data for Australia and 26 other high income countries (Austria, Belgium, Denmark, Finland, France, Germany, Greece, Iceland, Ireland, Italy, Malta, the Netherlands, Norway, Portugal, Spain, Sweden, Switzerland, United Kingdom, Israel, Brunei, Japan, Singapore, South Korea, New Zealand, Canada, USA) for the period 1980–2016 (1980 is the earliest year for which GBD data by age, sex, and cause of death are available for all countries). To improve the specificity and diagnostic accuracy of the cause of death data, the GBD Study applies a number of established procedures to the raw data to improve their comparability and diagnostic accuracy.10 GBD all‐cause mortality data for Australia, 1950–1979, were also examined for longer term trends (source: Institute of Health Metrics and Evaluation, University of Washington, Sept 2018). Based on the GBD list of 249 causes of death, mapped to causes of death in successive versions of the International Classification of Diseases (ICD),11 we report our findings for three major cause of death groups: communicable, maternal, neonatal and nutritional diseases; non‐communicable diseases; and injuries. We also report specific causes that had clear effects on differences in life expectancy at birth.
Life expectancy at birth is defined as the mean expected length of life given the age‐specific mortality rates for a population during a year or years. Life expectancy in Australia was compared with the population‐adjusted mean life expectancy at birth in all other high income countries, and separately with life expectancy in the USA and western Europe (the 18 European countries of the high income group), which together include about 72% of the population of the 26 other high income countries. The contributions of specific age groups and causes of death to differences in life expectancy between the two compared populations were estimated with the life table decomposition method developed by Arriaga and Pollard (Supporting Information).12,13,14 Decomposition analysis was conducted for four time points — 3‐year means for the periods 1980–1982, 1991–1993, 2002–2004, 2014–2016 — to estimate the contributions of age and cause of death to differences in life expectancy between Australia and the other countries. We also assessed how the effects of each age group and cause of death on life expectancy differed between the four time points (that is, changes over three separate periods of approximately equal length).
Birth cohort‐related differences between Australia and other countries were also analysed. The cohort year of birth was based upon the birth years of people in an age group who died during a defined 5‐year period. For example, people who died aged 75–79 years during 2012–2016 were born during 1932–1941; the cohort year is the midpoint of this period, 1937. For age groups from 5–9 years and for the period 1980–2016, we assessed the average annual contributions of corresponding birth cohorts in Australia and the 26 other high income countries to the difference in period life expectancy between Australia and the other countries; that is, the contribution to period life expectancy for people in a birth cohort relative to that of the corresponding birth cohort in the 26 other high income countries.
Ethics approval
Formal ethics approval for our study was not required as secondary, aggregated data were analysed.
Results
Life expectancy at birth in Australia: comparison with other high income countries, by age group
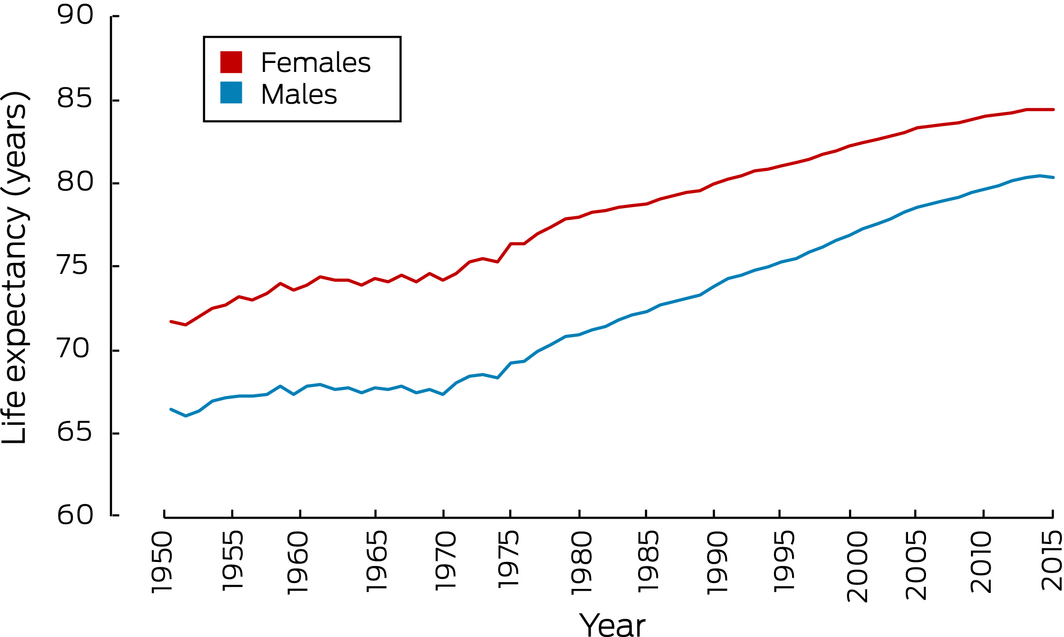
Life expectancy in Australia increased more rapidly from the 1970s to the 1990s than during the 1950s and 1960s, particularly for males. From 2003, life expectancy increases were less marked; during 2013–2016, life expectancy was steady for both sexes (Box 1). Supplementary regression analyses also indicated that growth in life expectancy has slowed markedly in recent years (Supporting Information, table 1).
The differences in life expectancy between Australia and other high income countries are summarised in Box 2; those between Australia and individual high income countries are summarised in the Supporting Information, tables 2 and 3.
Between 1981 and 2003, the difference in life expectancy for males between Australia and 26 other high income countries increased from +0.7 years to +2.3 years; it was +2.3 years in 2015. The change was mostly explained by increases in mortality differences for men aged 45–64 years during the 1980s and for those aged 65–84 years during the 1990s. The reduced difference in mortality for men aged 45–64 years during 2003–2015 was the major contributor to the lack of further increase in overall life expectancy at birth after 2003 (Box 3). In 1981, Australia was ranked 12th of 27 high income countries for life expectancy for males, 5th in 1992, 4th in 2003, and 5th in 2015; for overall change in male life expectancy during 2003–2015, it was ranked 19th.
Between 1981 and 2003, the difference in life expectancy for females between Australia and all other high income countries increased from +0.9 years to +1.3 years, largely because of increases in differences in mortality for women aged 45–64 and 65–84 years. The overall life expectancy difference declined to +1.1 years in 2015, primarily because of the reduced difference in mortality for women aged 65 or more (Box 4). In 1981, Australia was ranked 11th of 27 high income countries for life expectancy for females, 7th in 1992, 5th in 2003, and 7th in 2015. However, for overall change in life expectancy for females during 2003–2015, Australia was ranked 22nd.
Life expectancy at birth: comparison with the USA and western Europe
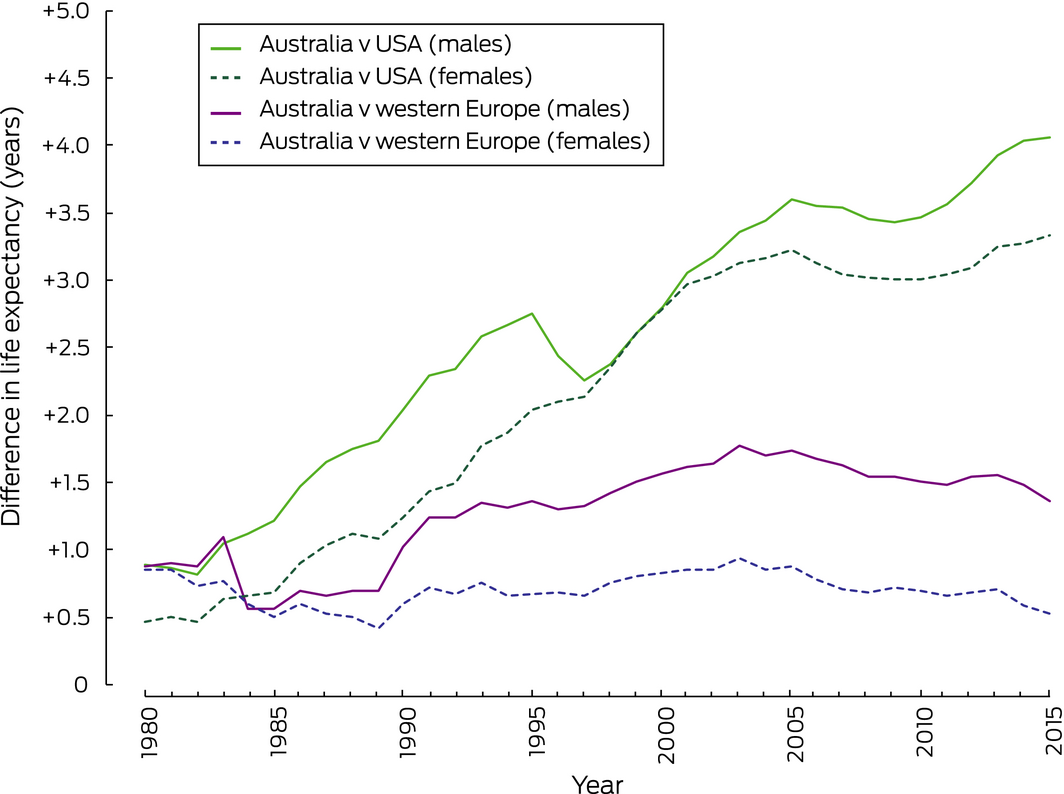
Between 1980 and 2016, the difference between Australia and the USA in life expectancy for males continuously increased from +0.9 to +4.0 years; the difference between Australia and western Europe increased from +0.9 to +1.3 years, with a peak of +1.8 years in 2003. Over the same period, the difference in life expectancy for females between Australia and the USA increased from +0.5 to +3.4 years, but the difference between Australia and western Europe declined from +0.9 to +0.5 years (Box 5, Supporting Information, figure 1).
Causes of death: comparison with western Europe
The greater life expectancy for males in Australia than in western Europe in 2015 (+1.4 years) was mostly attributable to lower mortality from major non‐communicable diseases, particularly lung cancer and ischaemic heart disease (each contributing 0.3 years to the difference in life expectancy). During 1981–2015, there was a net increase of 0.5 year in the difference in life expectancy; 0.9 year was attributable to the relative change in mortality associated with ischaemic heart disease, and 0.6 year to “other non‐communicable diseases” (ie, not otherwise specified non‐communicable diseases). The difference in life expectancy narrowed slightly during 2003–2015, mostly because of a reduction in the difference attributable to certain non‐communicable diseases, including cancers other than lung cancer and cardiovascular disease apart from ischaemic heart disease (Box 6).
The greater life expectancy for females in Australia than in western Europe in 2015 (+0.5 year) was mostly attributable to lower mortality from cardiovascular disease (other than ischaemic heart disease and cerebrovascular disease; 0.3 year). The recent reduction in the overall difference was mostly attributable to the mortality difference for non‐communicable disease shrinking (Box 6).
Causes of death: comparison with the United States
The greater life expectancy for males in Australia than in the USA in 2015 (+4.0 years) was mostly attributable to differences in mortality associated with ischaemic heart disease (0.9 year), lung cancer (0.3 year), and transport‐related injuries (0.3 year). The increase in the difference in life expectancy during 1981–2015 was primarily attributable to increases in differences for ischaemic heart disease (0.8 year), cerebrovascular diseases (0.5 year), chronic respiratory diseases (0.4 year), and transport‐related injuries (0.3 year) (Box 7).
The greater life expectancy for females in Australia than in the USA in 2015 (+3.3 years) was mostly attributable to differences in mortality associated with ischaemic heart disease (0.7 year), chronic respiratory diseases (0.3 year), and lung cancer (0.3 year). The increase in the difference in life expectancy during 1981–2015 was primarily attributable to increases in differences in mortality from ischaemic heart disease (contributing 0.6 years to the increase in difference), cerebrovascular disease (0.6 year), and chronic respiratory diseases (0.4 year) (Box 7).
Life expectancy at birth: effect of birth cohort
Australians born during 1927–1952 made a net positive contribution to overall differences between Australia and almost all other high income countries in life expectancy at birth (Supporting Information, figure 2). The net difference between Australia and other high income countries for people born in Australia from the late 1960s was positive for fewer than half the comparisons. That is, mortality among Australians now aged less than 50 years has been higher than for the corresponding birth cohorts in more than half of the other 26 high income countries; substantially higher in some cases.
Discussion
During the final two decades of the 20th century, life expectancy at birth for Australian males and, to a lesser extent, females increased more rapidly than in most other high income countries. By 2003, life expectancy for males was 2.3 years and for females 1.3 years greater in Australia than for the population‐adjusted value of the 26 other high income countries, and the absolute values were among the highest in the world. The increases were largely attributable to comparatively low mortality among people born shortly after the Second World War. Substantial and sustained declines in mortality from major cardiovascular diseases, particularly ischaemic heart disease and cerebrovascular diseases, and from chronic respiratory diseases and traffic accidents, greater than the corresponding changes in western Europe and the USA, contributed substantially to the rise in the global ranking of life expectancy for Australians. Lower mortality from lung cancer was also a contributor to Australia's higher life expectancy over the entire period.
A number of risk factors are associated with major cardiovascular diseases, chronic respiratory diseases and lung cancer, but a leading factor is cigarette smoking.15,16,17 Australia has been a global leader in tobacco control measures, prompted by campaigns by researchers, professional organisations, and non‐government organisations.18 Heavier taxation of tobacco products, advertising restrictions, plain packaging and smoke‐free environment legislation have achieved the consistently lower prevalence of smoking in Australia compared with western Europe over the past few decades.3,5,19,20 Australia was consequently one of the first countries to experience significant declines in mortality through such interventions,21 resulting in relatively low mortality among Australians born between the 1920s and early 1950s.
The decline in cardiovascular disease‐related mortality in Australia can also be attributed to improved diet (in particular, reduced intake of saturated fats) and its effects on blood pressure and cholesterol levels, contributing significantly, together with lower levels of smoking, to reducing mortality from coronary heart disease in Australia and New Zealand.4,22 Dietary improvements during the 1970s were the main factor in reducing cholesterol levels, several decades before statins were introduced.4 Improved medical care during this period also contributed to lower cardiovascular disease mortality in Australia, but its relative impact compared with other countries is unclear.23
In the past few years, however, growth in life expectancy for males and females has slowed in Australia, and this should concern public health policymakers. This slowing, mainly attributable to more moderate reductions in mortality from cardiovascular diseases and cancers, is difficult to explain, particularly when compared with trends in western Europe. Bold and effective public policies for controlling major non‐communicable diseases and injuries were implemented earlier and more effectively in Australia than in most other high income countries, where the benefits of such interventions, particularly those for reducing smoking, are still being realised. Declines in smoking do not appear to have been more rapid in western Europe than in Australia, but their impact on mortality will be more apparent where the initial prevalence is higher. More generally, as it becomes difficult to further reduce the already relatively low prevalence of smoking in Australia, it will be correspondingly more challenging to further reduce mortality from ischaemic heart disease, cerebrovascular diseases, and cancer with this strategy; future gains will increasingly depend on controlling other risk factors.
Poorer dietary habits than 30–40 years ago, particularly higher sugar and calorie intake, and their effects on health, including diabetes, obesity, high blood pressure, and high cholesterol levels, are now major public health problems in Australia. In the 2014–15 National Health Survey, more than half the respondents with hypertension did not report it as a current long term condition, and may therefore not have been receiving appropriate treatment, despite the increased mortality risk the condition entails.24 The prevalence of overweight and obesity has increased significantly in recent decades, and is now higher than in most other high income countries.25 While the long term health effects of being overweight are uncertain, there is evidence that the mortality risk from chronic diseases is increased even for moderately overweight people, and for extremely obese people is comparable with that for active smokers.9,26
That mortality gains in Australia are likely to be more modest than elsewhere is also suggested by the fact that age‐specific mortality for more recent birth cohorts is higher in Australia than in most other high income countries, particularly among adults currently aged 15–45 years, although it is not as high as in the USA.27 Indeed, it has recently been forecast that Australia's ranking with respect to life expectancy at birth will fall from 5th to 10th by 2040, and that life expectancy will rise more slowly than in all but four of the 26 other high income countries.28
Limitations
Differing diagnostic practices in the 27 countries included in our analysis are likely to have affected the comparability of the raw cause of death data. The GBD Study has developed and applies a number of methods to raw data to improve comparability, including re‐assigning instances of causes of death of limited public health value (eg, senility) to more specific causes, and using prevalence and other data sources to estimate mortality for some causes, such as dementia, for which inconsistencies between countries in assignment have been identified.10,29 Residual differences in cause of death data that would affect comparative analyses are likely, especially in older age groups.
Conclusion
Life expectancy in Australia is among the highest in the world, a testament to boldly progressive public health interventions over several decades. Mortality among Australians born immediately after the Second World War, many of whom are still living, has been relatively low, which may support further rises in life expectancy. However, there are several major barriers to marked increases, including the notably higher mortality of more recent birth cohorts and the comparative failure of efforts to reduce levels of overweight and obesity. Other high income countries have greater scope for reducing the prevalence of smoking. As a result, our high global ranking with regard to life expectancy at birth is unlikely to be maintained unless new strategies for reducing mortality associated with specific behaviours are developed and deployed effectively.
Box 2 – Life expectancy at birth for Australia and 26 other high income countries, 1980–2016, by sex
|
|
1980–1982 |
1991–1993 |
2002–2004 |
2014–2016 |
|||||||||||
|
Males |
Females |
Males |
Females |
Males |
Females |
Males |
Females |
||||||||
|
|
|||||||||||||||
|
Australia |
71.3 |
78.3 |
74.6 |
80.6 |
78.0 |
82.9 |
80.5 |
84.5 |
|||||||
|
Other high income countries |
70.6 |
77.3 |
73.0 |
79.8 |
75.7 |
81.6 |
78.2 |
83.4 |
|||||||
|
Western Europe |
70.4 |
77.5 |
73.3 |
79.9 |
76.3 |
82.0 |
79.1 |
84.0 |
|||||||
|
United States |
70.4 |
77.8 |
72.2 |
79.1 |
74.7 |
79.8 |
76.4 |
81.2 |
|||||||
|
|
|||||||||||||||
|
|
|||||||||||||||
Box 3 – Age group‐specific contributions to differences between Australia and 26 high income countries in life expectancy at birth for males, 1980–2016*
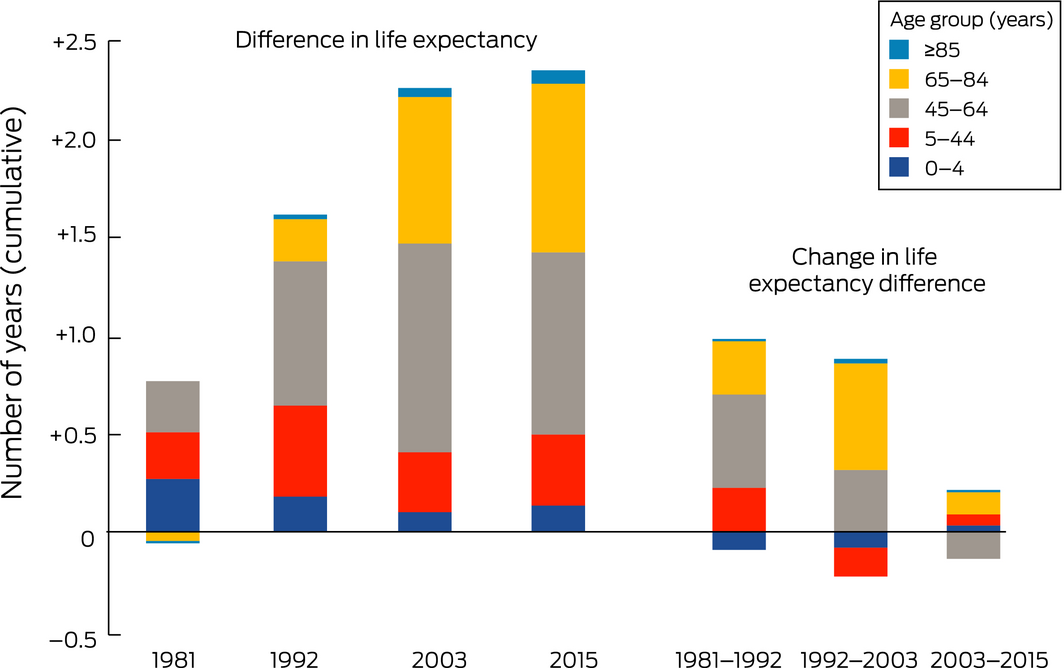
*Years are 3‐year means for 1980–1982, 1991–1993, 2002–2004, 2014–2016. Ranking of change in life expectancy (among 27 high income countries): 1981–1992, 5th; 1992–2003, 6th; 2003–2015, 19th.◆
Box 4 – Age group‐specific contributions to differences between Australia and 26 high income countries in life expectancy at birth for females, 1980–2016*
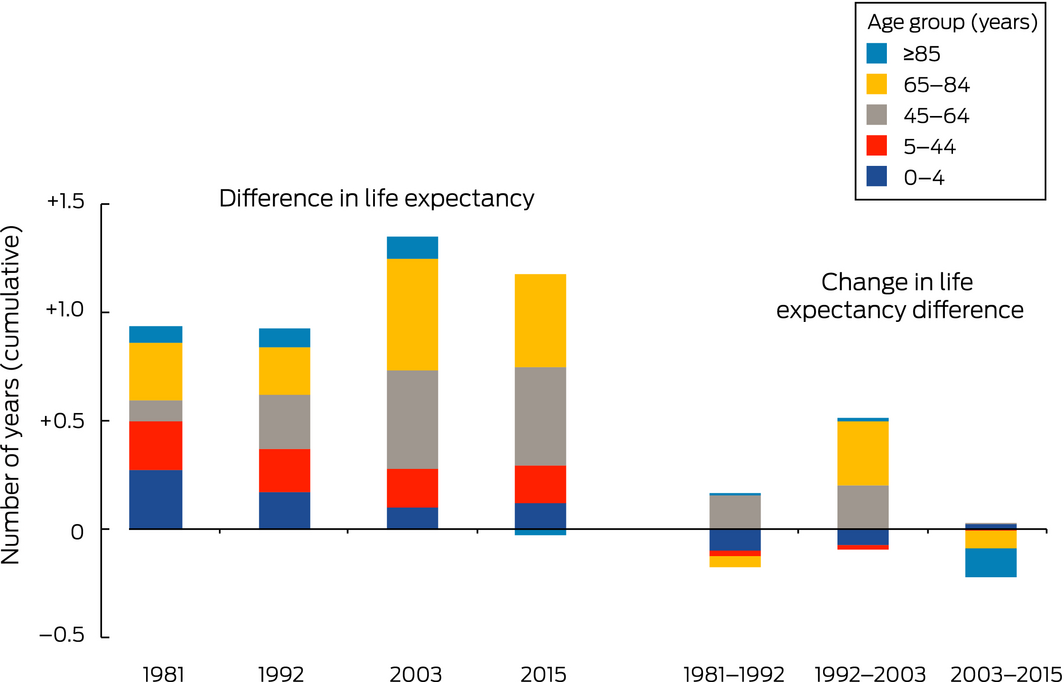
*Years are 3‐year means for 1980–1982, 1991–1993, 2002–2004, 2014–2016. Ranking of change in life expectancy (among 27 high income countries): 1981–1992, 15th; 1992–2003, 13th; 2003–2015, 22nd.◆
Box 5 – Differences between Australia and the United States and western Europe in life expectancy at birth, 1980–2016, by sex
Box 6 – Contributions of specific causes of death to differences between Australia and western Europe in life expectancy at birth, 1980–2016,* by sex
|
Cause of death |
Contribution (years) |
Change in contribution (years) |
|||||||||||||
|
1981 |
1992 |
2003 |
2015 |
1981–1992 |
1992–2003 |
2003–2015 |
|||||||||
|
|
|||||||||||||||
|
Males |
|
|
|
|
|
|
|
||||||||
|
Communicable diseases† |
0.5 |
0.2 |
0.1 |
0.1 |
–0.3 |
–0.1 |
0.0 |
||||||||
|
Non‐communicable disease |
0.4 |
0.9 |
1.5 |
1.3 |
0.5 |
0.6 |
–0.3 |
||||||||
|
Lung cancer |
0.1 |
0.3 |
0.3 |
0.3 |
0.1 |
0.1 |
0.0 |
||||||||
|
Other cancers |
0.2 |
0.3 |
0.2 |
0.0 |
0.1 |
–0.1 |
–0.2 |
||||||||
|
Ischaemic heart disease |
–0.6 |
0.0 |
0.2 |
0.3 |
0.6 |
0.3 |
0.0 |
||||||||
|
Cerebrovascular disease |
0.4 |
0.2 |
0.2 |
0.1 |
0.2 |
0.0 |
–0.1 |
||||||||
|
Other cardiovascular diseases |
0.2 |
0.2 |
0.2 |
0.1 |
0.0 |
0.0 |
–0.2 |
||||||||
|
Cirrhosis and chronic liver disease |
0.2 |
0.2 |
0.2 |
0.1 |
0.0 |
0.0 |
–0.1 |
||||||||
|
Other non‐communicable diseases |
–0.1 |
–0.2 |
0.2 |
0.4 |
–0.1 |
0.4 |
0.3 |
||||||||
|
Injuries |
–0.1 |
0.1 |
0.1 |
0.0 |
0.2 |
–0.1 |
–0.1 |
||||||||
|
Transport‐related injuries |
–0.2 |
0.1 |
0.0 |
0.0 |
0.3 |
0.0 |
–0.1 |
||||||||
|
Other injuries |
0.1 |
0.0 |
0.0 |
0.0 |
0.0 |
0.0 |
0.0 |
||||||||
|
Total |
0.9 |
1.3 |
1.7 |
1.4 |
0.4 |
0.4 |
–0.3 |
||||||||
|
Females |
|
|
|
|
|
|
|
||||||||
|
Communicable diseases† |
0.3 |
0.2 |
0.1 |
0.1 |
–0.1 |
–0.1 |
0.0 |
||||||||
|
Non‐communicable disease |
0.5 |
0.5 |
0.8 |
0.5 |
0.0 |
0.3 |
–0.3 |
||||||||
|
Lung cancer |
0.0 |
–0.1 |
0.0 |
0.0 |
0.0 |
0.0 |
0.0 |
||||||||
|
Other cancers |
0.2 |
0.1 |
0.2 |
0.1 |
0.0 |
0.1 |
–0.1 |
||||||||
|
Ischaemic heart disease |
–0.3 |
–0.2 |
0.1 |
0.1 |
0.1 |
0.3 |
0.0 |
||||||||
|
Cerebrovascular disease |
0.2 |
0.2 |
0.1 |
0.0 |
0.0 |
–0.1 |
–0.1 |
||||||||
|
Other cardiovascular diseases |
0.2 |
0.2 |
0.3 |
0.3 |
0.0 |
0.1 |
0.0 |
||||||||
|
Other non‐communicable diseases |
0.2 |
0.2 |
0.2 |
0.1 |
–0.1 |
0.0 |
–0.1 |
||||||||
|
Injuries |
0.0 |
0.1 |
0.0 |
–0.1 |
0.0 |
0.0 |
–0.1 |
||||||||
|
Total |
0.8 |
0.7 |
0.9 |
0.5 |
–0.1 |
0.2 |
–0.4 |
||||||||
|
|
|||||||||||||||
|
* Years are 3‐year means for 1980–1982, 1991–1993, 2002–2004, 2014–2016. † Includes communicable diseases, as well as maternal, neonatal and nutritional diseases, as defined by the GBD Study.10 Bold: Contributions and changes in contribution of 0.3 year or more. ◆ |
|||||||||||||||
Box 7 – Contributions of specific causes of death to differences between Australia and the United States in life expectancy at birth, 1980–2016,* by sex
|
Cause of death |
Contribution (years) |
Change in contribution (years) |
|||||||||||||
|
1981 |
1992 |
2003 |
2015 |
1981–1992 |
1992–2003 |
2003–2015 |
|||||||||
|
|
|||||||||||||||
|
Males |
|
|
|
|
|
|
|
||||||||
|
Communicable diseases† |
0.3 |
0.8 |
0.5 |
0.4 |
0.5 |
–0.3 |
0.0 |
||||||||
|
Non‐communicable disease |
0.1 |
1.0 |
2.2 |
2.8 |
0.9 |
1.2 |
0.6 |
||||||||
|
Lung cancer |
0.2 |
0.4 |
0.4 |
0.3 |
0.1 |
0.0 |
–0.1 |
||||||||
|
Other cancers |
0.0 |
0.1 |
0.1 |
0.0 |
0.0 |
0.0 |
–0.1 |
||||||||
|
Ischaemic heart disease |
0.2 |
0.4 |
0.8 |
0.9 |
0.3 |
0.4 |
0.1 |
||||||||
|
Cerebrovascular disease |
–0.3 |
–0.1 |
0.1 |
0.1 |
0.2 |
0.2 |
0.1 |
||||||||
|
Other cardiovascular diseases |
–0.2 |
–0.1 |
0.0 |
0.1 |
0.1 |
0.0 |
0.2 |
||||||||
|
Cirrhosis and chronic liver disease |
0.1 |
0.1 |
0.2 |
0.2 |
0.0 |
0.0 |
0.1 |
||||||||
|
Chronic respiratory diseases |
–0.2 |
–0.1 |
0.2 |
0.2 |
0.1 |
0.2 |
0.1 |
||||||||
|
Drug use disorders |
0.0 |
0.0 |
0.1 |
0.2 |
0.0 |
0.1 |
0.1 |
||||||||
|
Other non‐communicable diseases |
0.2 |
0.2 |
0.5 |
0.6 |
0.1 |
0.2 |
0.2 |
||||||||
|
Injuries |
0.4 |
0.6 |
0.7 |
0.8 |
0.2 |
0.0 |
0.1 |
||||||||
|
Violence |
0.3 |
0.3 |
0.2 |
0.2 |
0.0 |
–0.1 |
0.0 |
||||||||
|
Transport‐related injuries |
0.0 |
0.2 |
0.3 |
0.3 |
0.2 |
0.1 |
0.0 |
||||||||
|
Other injuries |
0.2 |
0.1 |
0.2 |
0.3 |
0.0 |
0.0 |
0.1 |
||||||||
|
Total |
0.9 |
2.4 |
3.3 |
4.0 |
1.5 |
0.9 |
0.7 |
||||||||
|
Females |
|
|
|
|
|
|
|
||||||||
|
Communicable diseases† |
0.3 |
0.4 |
0.4 |
0.4 |
0.1 |
0.0 |
0.0 |
||||||||
|
Non‐communicable disease |
0.1 |
0.9 |
2.4 |
2.6 |
0.9 |
1.5 |
0.2 |
||||||||
|
Lung cancer |
0.3 |
0.4 |
0.4 |
0.3 |
0.1 |
0.0 |
–0.1 |
||||||||
|
Ischaemic heart disease |
0.1 |
0.3 |
0.7 |
0.7 |
0.2 |
0.4 |
0.0 |
||||||||
|
Cerebrovascular disease |
–0.5 |
–0.2 |
0.1 |
0.1 |
0.3 |
0.3 |
0.0 |
||||||||
|
Chronic respiratory diseases |
–0.1 |
0.0 |
0.3 |
0.3 |
0.1 |
0.2 |
0.1 |
||||||||
|
Drug use disorders |
0.0 |
0.0 |
0.1 |
0.1 |
0.0 |
0.1 |
0.1 |
||||||||
|
Other non‐communicable diseases |
0.2 |
0.5 |
0.9 |
1.1 |
0.2 |
0.5 |
0.1 |
||||||||
|
Injuries |
0.1 |
0.2 |
0.3 |
0.3 |
0.1 |
0.1 |
0.0 |
||||||||
|
Total |
0.5 |
1.6 |
3.1 |
3.3 |
1.1 |
1.5 |
0.2 |
||||||||
|
|
|||||||||||||||
|
* Years are 3‐year means for 1980–1982, 1991–1993, 2002–2004, 2014–2016. † Includes communicable diseases, as well as maternal, neonatal and nutritional diseases, as defined by the GBD Study.10 Bold: Contributions and changes in contribution of 0.3 year or more. ◆ |
|||||||||||||||
Received 17 October 2018, accepted 22 January 2019
- Alan D Lopez
- Tim Adair
- Melbourne School of Population and Global Heath, University of Melbourne, Melbourne, VIC
We acknowledge Mohsen Naghavi of the Institute of Health Metrics and Evaluation, University of Washington, for supplying the data analysed in our study.
No relevant disclosures.
- 1. Uemura K, Pisa Z. Trends in cardiovascular disease mortality in industrialized countries since 1950. World Health Stat Q 1988; 41: 155–178.
- 2. GBD Mortality Collaborators. Global, regional, and national under‐5 mortality, adult mortality, age‐specific mortality, and life expectancy, 1970–2016: a systematic analysis for the Global Burden of Disease Study 2016. Lancet 2017; 390: 1084–1150.
- 3. Adair T, Hoy D, Dettrick Z, Lopez AD. Reconstruction of long‐term tobacco consumption trends in Australia and their relationship to lung cancer mortality. Cancer Causes Control 2011; 22: 1047–1053.
- 4. Taylor R, Dobson A, Mirzaei M. Contribution of changes in risk factors to the decline of coronary heart disease mortality in Australia over three decades. Eur J Cardiovasc Prev Rehabil 2006; 13: 760–768.
- 5. Taylor R, Page A, Danquah J. The Australian epidemic of cardiovascular mortality 1935–2005: effects of period and birth cohort. J Epidemiol Community Health 2012; 66: e18.
- 6. Australian Institute of Health and Welfare. National Drug Strategy Household Survey 2016: detailed findings (PHE 214). Canberra: AIHW, 2017.
- 7. Hayes AJ, Lung TW, Bauman A, Howard K. Modelling obesity trends in Australia: unravelling the past and predicting the future. Int J Obes (Lond) 2017; 41: 178–185.
- 8. O'Flaherty M, Allender S, Taylor R, et al. The decline in coronary heart disease mortality is slowing in young adults (Australia 1976–2006): a time trend analysis. Int J Cardiol 2012; 158: 193–198.
- 9. Prospective Studies Collaboration; Whitlock G, Lewington S, Sherliker P, et al. Body‐mass index and cause‐specific mortality in 900 000 adults: collaborative analyses of 57 prospective studies. Lancet 2009; 373: 1083–1096.
- 10. GBD Causes of Death Collaborators. Global, regional, and national age‐sex specific mortality for 264 causes of death, 1980–2016: a systematic analysis for the Global Burden of Disease Study 2016. Lancet 2017; 390: 1151–1210.
- 11. GBD Mortality Causes of Death Collaborators. Global, regional, and national life expectancy, all‐cause mortality, and cause‐specific mortality for 249 causes of death, 1980–2015: a systematic analysis for the Global Burden of Disease Study 2015. Lancet 2016; 388: 1459–1544.
- 12. Arriaga EE. Measuring and explaining the change in life expectancies. Demography 1984; 21: 83–96.
- 13. Pollard J. The expectation of life and its relationship to mortality. J Inst Actuar 1982; 109: 225–240.
- 14. Preston S, Heuveline P, Guillot M. Demography: measuring and modeling population processes. Oxford: Blackwell, 2001.
- 15. Doll R, Peto R, Boreham J, Sutherland I. Mortality in relation to smoking: 50 years’ observations on male British doctors. BMJ 2004; 328: 1519.
- 16. Pirie K, Peto R, Reeves GK, et al; Million Women Study Collaborators. The 21st century hazards of smoking and benefits of stopping: a prospective study of one million women in the UK. Lancet 2013; 381: 133–141.
- 17. Thun MJ, Carter BD, Feskanich D, et al. 50‐year trends in smoking‐related mortality in the United States. N Engl J Med 2013; 368: 351–364.
- 18. Walker RB. Under fire: a history of tobacco smoking in Australia. Melbourne: Melbourne University Press, 1984.
- 19. Forey B, Hamling J, Hamling J, et al. International smoking statistics; web edition. Sutton (UK): PN Lee Statistics & Computing; updated Dec 2016. www.pnlee.co.uk/iss.htm (viewed Feb 2019).
- 20. Institute for Health Metrics and Evaluation. Tobacco Viz. Seattle (WA): University of Washington, 2017. http://vizhub.healthdata.org/tobacco (viewed Feb 2019).
- 21. Peto R, Lopez AD, Boreham J, et al. Mortality from tobacco in developed countries: indirect estimation from national vital statistics. Lancet 1992; 339: 1268–1278.
- 22. Jackson R, Beaglehole R. Trends in dietary fat and cigarette smoking and the decline in coronary heart disease in New Zealand. Int J Epidemiol 1987; 16: 377–382.
- 23. Ezzati M, Obermeyer Z, Tzoulaki I, et al. Contributions of risk factors and medical care to cardiovascular mortality trends. Nat Rev Cardiol 2015; 12: 508–530.
- 24. Australian Bureau of Statistics. 4364.0.55.002. Health service usage and health related actions, Australia, 2014–15. Mar 2017. http://www.abs.gov.au/ausstats/abs@.nsf/mf/4364.0.55.002 (viewed Feb 2019).
- 25. Australian Institute of Health and Welfare. A picture of overweight and obesity in Australia 2017 (PHE 216). Canberra: AIHW, 2017.
- 26. Global BMI Mortality Collaboration; Di Angelantonio E, Bhupathiraju SN, Wormser D, et al. Body‐mass index and all‐cause mortality: individual‐participant‐data meta‐analysis of 239 prospective studies in four continents. Lancet 2016; 388: 776–786.
- 27. Case A, Deaton A. Rising morbidity and mortality in midlife among white non‐Hispanic Americans in the 21st century. Proc Natl Acad Sci USA 2015; 112: 15078–15083.
- 28. Foreman KJ, Marquez N, Dolgert A, et al. Forecasting life expectancy, years of life lost, and all‐cause and cause‐specific mortality for 250 causes of death: reference and alternative scenarios for 2016–40 for 195 countries and territories. Lancet 2018; 392: 2052–2090.
- 29. Naghavi M, Makela S, Foreman K, et al. Algorithms for enhancing public health utility of national causes‐of‐death data. Popul Health Metr 2010; 8: 9.
Abstract
Objectives: To compare life expectancy at birth in Australia during 1980–2016 with that in other high income countries; to estimate the contributions of age at death and cause of death to differences between Australia and these countries.
Design, setting, participants: Data on deaths by age, sex, and cause in Australia and 26 other high income countries obtained from the Global Burden of Disease study.
Main outcome measures: Contributions of age, cause of death, and birth cohort to differences in life expectancy between Australia and other high income countries and to changes in the differences.
Results: From 1981 to 2003, life expectancy at birth increased rapidly in Australia, both in absolute terms and in comparison with other high income countries. The main contributor to greater increases for males in Australia than in western Europe was lower mortality from ischaemic heart disease; compared with the United States, mortality from ischaemic heart disease, cerebrovascular disease, and transport‐related injuries was lower. Since 2003, life expectancy has increased more slowly for both sexes than in most other high income countries, mainly because declines in mortality from cardiovascular disease and cancer have slowed. Age‐specific mortality for people born since the 1970s is higher in Australia than in most high income countries.
Conclusions: Recent declines in mortality in Australia have been relatively modest. Together with the high prevalence of obesity and the limited scope for further increasing life expectancy by reducing the prevalence of smoking, this suggests that future life expectancy increases will be smaller than in other high income countries. Improved control of health risk factors will be required if further substantial life expectancy increases in Australia are to be achieved.