


The known: Influenza and pertussis vaccinations during pregnancy are safe, and effectively prevent infections in women and their infants.
The new: Pertussis vaccination of pregnant women in Victoria increased during 2015–17 from 38% to 82%. The overall rate of influenza vaccination was 39%, but the level varied by season. Individual and hospital‐level factors contributed to variations in uptake, including lower rates among overseas‐born women, women who smoked during pregnancy, and Aboriginal and Torres Strait Islander Australian women.
The implications: Structural changes at the system level may improve maternal vaccination rates. Embedding the delivery of vaccinations in antenatal care pathways should be a priority.
Vaccination of pregnant women against influenza and pertussis is recommended, to reduce the risks of infection for both mother and child.1,2 Despite strong evidence for their safety and effectiveness,3,4,5 rates of vaccination are suboptimal in many countries.6,7,8 Influenza vaccine can be given at any time during pregnancy, but preferably before the influenza season; pertussis vaccine should be given during the third trimester (preferably 28–32 weeks).9
In this investigation, we explored variations by time of year and hospital in the uptake of influenza and pertussis vaccination by pregnant women in Victoria and the hospital‐ and individual‐level factors associated with vaccination uptake. Influenza vaccination for pregnant women was added to the Australian National Immunisation Program in 2010, as was pertussis vaccination (replacing state‐based programs) in 2018.9 In Victoria, the maternal pertussis vaccination program commenced in June 2015, the main objective being to protect infants before they receive scheduled vaccinations at 2, 4 and 6 months of age.2
Methods
Data sources
We analysed data from the Victorian Perinatal Data Collection (VPDC), a population surveillance system that captures information on obstetric conditions, procedures, pregnancy, and birth outcomes (live and stillbirths) registered under the Victorian Birth, Deaths and Marriages Registration Act 1996.10,11
To examine variations in vaccination uptake by time of year, we analysed data for all pregnancies captured by the VPDC that ended during 1 July 2015 – 30 June 2017. Data were aggregated by the month and year the pregnancy ended, hospital of birth, and maternal vaccination status. We restricted analyses of hospital‐level variation to pregnancies that ended during the most recent financial year (2016–17) to reflect contemporary vaccination uptake.
To examine individual‐level factors associated with vaccination, we separately analysed data for all pregnancies that ended during 1 January 2016 – 31 December 2016: maternal vaccination status, socio‐demographic status, gravidity, date the pregnancy ended, gestational age at birth, hospital campus of birth (or home births), and discipline of antenatal care provider. The midwife attending the birth generally supplies information on maternal vaccination status to the VPDC according to the woman's self‐reported understanding of her vaccination status during the current pregnancy or any available written records, including medical or antenatal care files.
To explore hospital‐level variations in vaccination practice, senior maternity managers, maternity clinicians, midwife practitioners, and researchers who attended a VPDC forum in July 2018 were surveyed. The voluntary survey comprised eight closed questions related to local systems and practices for promoting and administering maternal vaccinations. Data on the respondents’ places of work were captured, including hospital capability level, public or private status, and whether the respondent was a privately practising midwife.
Data preparation
Pregnancies ending in non‐maternity or interstate hospitals or in terminations were excluded from analyses. Hospitals were classified according to their capability level, which reflects the complexity of maternal and neonatal care offered. Level 6 hospitals are high capability tertiary maternity care services that can support complex pregnancies and have neonatal intensive care facilities; level 1 services are able to support normal and low risk pregnancies.12 Private hospitals and homebirths in Victoria are not included in this framework, and were therefore treated separately. For analyses of individual‐level factors associated with pertussis vaccination, pregnancies ending earlier than 28 weeks’ gestation were excluded.
Statistical analyses
Vaccination uptake (coverage) was calculated as the number of pregnant women reported to have received a vaccine as a proportion of all pregnancies ending during the relevant time period or in the relevant birth hospital, summarised as descriptive statistics.
We identified factors associated with vaccination by logistic regression, constructing separate models for our two main outcome measures, vaccination against influenza or pertussis. We developed a number of candidate models, each incorporating known and plausible confounding factors. Subsequent candidate models were developed iteratively, incorporating all available variables in a stepwise fashion, entered in order of their strength of association in univariate analyses. Each candidate model was assessed for goodness of fit with the Akaike information criterion (AIC);13 the model with the smallest AIC value was selected as the final adjusted model. All variables in the univariate model were ultimately included in the final multivariate models. Analyses were performed in Stata 14.0 (StataCorp).
Ethics approval
Ethics approval was obtained from the Australian Department of Health and Human Services (DHHS) Human Research Ethics Committee (reference, 15/17) and from the Consultative Council for Obstetric and Paediatric Morbidity and Mortality. The study was supported by DHHS as part of vaccine program evaluation.
Results
In Victoria, 154 053 pregnancies ended between July 2015 and June 2017. The total number of births was stable over time (median, 6560 births per month). After excluding nine pregnancies that ended in non‐maternity hospitals and 64 that were terminated, 153 980 pregnancies (from 67 hospitals) were included in our analyses, of which 117 275 (76.2%) ended in public hospitals, including 75 643 in capability level 5 or 6 hospitals (64.5% of pregnancies ending in public hospitals). About one‐quarter of pregnancies (36 427, 23.7%) ended in private hospitals, and 84 (< 0.1%) ended at home (Box 1). During the 2‐year period, 59 968 pregnant women (38.9%) were vaccinated against influenza and 98 583 (64.0%) against pertussis.
Differences in vaccination uptake by time of year and hospital
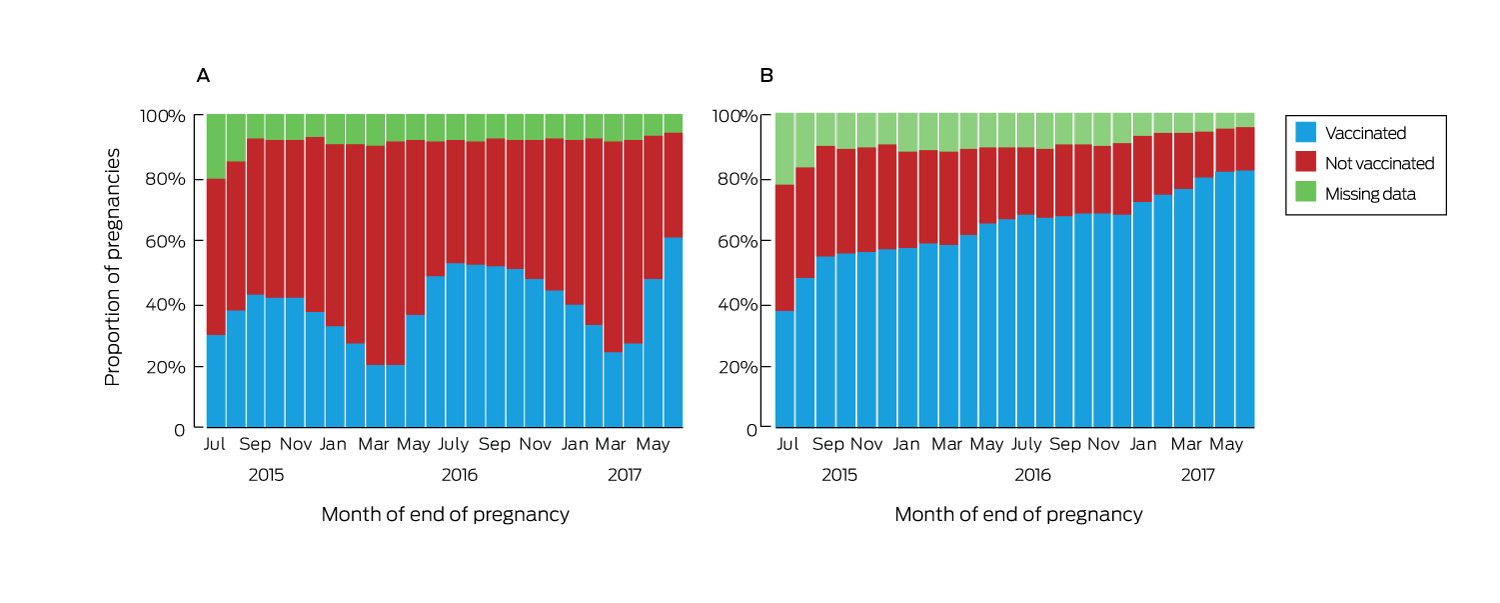
Vaccination uptake varied by month of pregnancy end date. The median proportion of women vaccinated against influenza was 40.4% (interquartile range [IQR], 31.4–48.2%; range, 20.1–60.9%). Uptake was higher for pregnancies ending in winter or spring, and the proportions vaccinated in each month of the first six months of 2017 were higher than for the corresponding months of 2016 (Box 2, A). The proportion of women vaccinated against pertussis increased steadily over time, without seasonal variation; the median coverage was 64.6% (range, 37.5–82.2%; IQR, 57.1–70.2%) (Box 2, B).
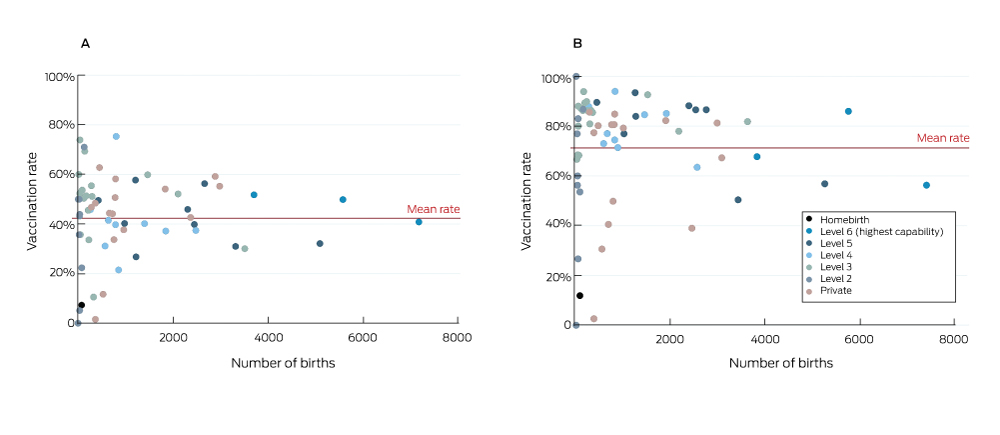
Uptake varied considerably between hospitals (Box 3). After excluding 194 pregnancies for which hospital data were missing, the median influenza vaccination coverage for pregnancies that ended during 2016–17 was 45.0% (IQR, 34.7–52.6%; range, 0–75.3%). For pertussis vaccination, median coverage was 80.4% (IQR, 65.1–86.3%; range; 0–100%). The proportions of women whose pregnancies ended at home who were vaccinated during pregnancy were low (influenza, 7%; pertussis, 12%). In one capability level 6 hospital and two capability level 5 hospitals with a total of 16 000 births annually, overall uptake of pertussis vaccination was about 55%; that is, about 7200 women whose pregnancies ended at these three hospitals were not vaccinated against pertussis.
During the 2016 calendar year, women whose pregnancies ended in public hospitals were more likely to be vaccinated than those in private hospitals (influenza: adjusted odds ratio [aOR], 1.15; 95% confidence interval [CI], 1.09–1.22; pertussis: aOR, 1.37; 95% CI, 1.28–1.46). Women giving birth in level 6 public hospitals were more likely to be vaccinated against influenza than in lower level public hospitals, but there was considerable variation in rates between hospitals within capability levels (Box 3, Box 4).
Factors associated with vaccination uptake
A total of 79 310 pregnancies ended during 1 January 2016 – 31 December 2016. Overall, 31 925 pregnant women were vaccinated against influenza (40.3%), 40 590 (51.2%) were not vaccinated, and data were missing for 6795 (8.6%) (Box 4); 51 024 (64.7%) were vaccinated against pertussis, 19 292 (24.5%) were not vaccinated, and data were missing for 8541 (10.8%) (Box 5). After excluding 453 pregnancies that ended earlier than 28 weeks’ gestation, 78 887 pregnancies were included in our analyses of factors influencing maternal pertussis vaccination. In total, 28 432 women (36.1%) were vaccinated against both influenza and pertussis, and 16 872 (21.4%) against neither (data not shown).
Factors associated with influenza vaccination included greater maternal age (35 years or older v under 20 years of age: aOR, 1.35; 95% CI, 1.18–1.56), primigravidity (aOR, 1.37; 95% CI, 1.32–1.41), and early contact with an antenatal care provider (by 11 weeks v at 24 weeks or later: aOR, 1.63; 95% CI, 1.52–1.75). Women receiving GP‐led antenatal care were more likely to be vaccinated than women receiving obstetrician‐led care (aOR, 1.57; 95% CI, 1.49–1.65), as were women in rural areas and with partners. The odds of vaccination were statistically significantly lower for women who smoked during pregnancy (aOR, 0.65; 95% CI, 0.61–0.70) and women born overseas (aOR, 0.91; 95% CI, 0.88–0.94); they were also lower for Aboriginal and Torres Strait Islander women (aOR, 0.91; 95% CI, 0.88–1.04) (Box 4).
Factors associated with pertussis vaccination included greater maternal age (20–34 years v under 20 years of age: aOR, 1.42; 95% CI, 1.16–1.63), residing in rural Victoria (v metropolitan Victoria: aOR, 1.87; 95% CI, 1.77–1.97), being married or in a de facto relationship (aOR, 1.18; 95% CI, 1.12–1.25), primigravidity (aOR, 1.80; 95% CI, 1.73–1.87), and early contact with antenatal care provider (by 11 weeks v at 24 weeks or later: aOR, 1.83; 95% CI, 1.70–1.97). Women receiving GP‐led antenatal care were more likely to be vaccinated than women receiving obstetrician‐led care (aOR, 1.49; 95% CI, 1.40–1.58); the odds of vaccination also rose with socio‐economic status of residence. Aboriginal and Torres Strait Islander women (aOR, 0.69; 95% CI, 0.60–0.79), women born overseas (aOR, 0.68; 95% CI, 0.65–0.70), and women who smoked during pregnancy (aOR, 0.69; 95% CI, 0.65–0.74) were less likely to have been vaccinated against pertussis (Box 5).
Hospital maternal vaccination practices
Fifty‐five of 134 VPDC forum participants responded to the survey (response rate, 41%), including 40 from public hospitals (73% of respondents), with good representation from all capability levels (level 2, two; level 3, twelve; level 4, eight; level 5, eleven; level 6, seven). Seven respondents (13%) worked in private hospitals; three (6%) were privately practising midwives. Twenty‐three respondents (42%) indicated that influenza vaccines were always (8; 15%) or usually (15; 27%) administered to pregnant women as part of routine antenatal care at their place of work; 25 (46%) indicated that pertussis vaccines were always (17; 31%) or usually (8; 15%) administered as part of routine antenatal care. After excluding respondents who said that maternal vaccines were always administered, 37 of 47 (79%) indicated that practitioners routinely discussed and referred women to GPs for influenza vaccination and 32 of 38 (84%) that practitioners routinely discussed and referred women to GPs for pertussis vaccination. Workplace systems for promoting maternal vaccination included antenatal care checklists prompting discussion of maternal vaccines (42; 76%), providing educational material about maternal vaccination (35; 64%), immunisation services in antenatal care clinics (11; 20%), and standing orders for delivery of maternal vaccines by midwives (10; 18%). Three respondents from private hospitals indicated that dedicated immunisation services were provided in antenatal care clinics.
Discussion
Uptake of pertussis vaccination by pregnant women in Victoria increased from 38% in July 2015 to 82% in June 2017, a higher rate than estimated for comparable countries (eg, United Kingdom, 2017: 72%; United States, 2017: 49%).6,7 Uptake of influenza vaccination was only 39% during 2015–17, similar to estimates in other countries with comparable programs;7,8 however, the rate varied seasonally, typically rising to more than 50% during winter and spring, with coverage reaching 60% during the severe 2017 influenza season.
Uptake of influenza vaccination may be influenced by concerns among pregnant women and antenatal care providers about the severity of infection during pregnancy14,15 and the safety of influenza vaccines.16 Pregnant women are generally more concerned about health risks to their infants than to themselves; as they view influenza as primarily as their own problem, but pertussis as a greater risk for their babies, women are more likely to accept pertussis vaccination.15 During 2015–17, uptake of influenza vaccination increased markedly during the influenza season (typically May–October), probably reflecting both awareness and availability of the vaccine. Additional public education and targeted communications to antenatal care providers may improve awareness about the importance of influenza vaccination during pregnancy, regardless of the time of year.
In contrast, uptake of pertussis vaccination increased steadily across 2015–17. This may reflect continued promotion by state and national bodies of the importance of maternal pertussis vaccination, and increased awareness among pregnant women of the seriousness of pertussis in infants. Media reports of infant deaths caused by pertussis and active campaigning by affected parents may have influenced vaccination uptake.
The reasons for the hospital‐level variation in maternal vaccination rates are unclear, but the responses to our survey suggest that system factors may be involved. Fewer than half the respondents indicated that the vaccines were always or usually administered during routine antenatal care; it was also reported that many women were referred to GPs for vaccination. Few respondents reported standing orders or dedicated immunisation services that enabled midwives to vaccinate women during antenatal appointments. Other structural barriers may include the lack of midwives certified as nurse immunisers. Uptake of maternal vaccination could be improved by system‐level modifications to antenatal care in hospitals, with standing orders for midwife delivery17 and educational and other structural interventions, such as antenatal care checklists,18 as employed in a variety of settings, including obstetric medicine.19 Standing orders for maternal vaccination or accreditation of “vaccine champion” nurse immunisers could be included in hospital‐based antenatal care.
At the individual level, we identified several groups for whom vaccination rates were particularly low. In Australia, uptake of maternal vaccination by Aboriginal and Torres Strait Islander women has been reported to be low20 to moderate.21 In our study, uptake of maternal influenza and pertussis vaccination by Indigenous Australian women was lower than among non‐Indigenous women; the difference for maternal influenza vaccination was not statistically significant, but the coverage gap should be further investigated. Uptake was also lower among women born overseas, particularly pertussis vaccination. Lower uptake of pertussis vaccines during pregnancy has been reported for ethnic minorities with geographic problems of access and lower health literacy.22 Targeted messaging to these communities and their antenatal care providers, as well as improved pregnancy care models, may increase their vaccination rates. Smoking, an important risk factor for respiratory infection, was also associated with lower coverage.
Our results suggest several steps for improving vaccination coverage among pregnant women (Box 6). Commencing antenatal care late was associated with lower coverage, and recommendations by health care providers have a strong influence on the likelihood of vaccination during pregnancy.23 Further, we found that GP‐led care was associated with higher rates of vaccination than obstetrician‐led care, possibly reflecting the expertise of GPs in delivering a range of vaccines. It may also indicate attitudinal, logistic or other barriers to obstetricians offering vaccines, such as the lack of systems and processes for their ordering or storing vaccines.
Limitations
Although we used a stable population‐wide dataset, we were unable to explore factors that influence vaccination uptake but are not captured by the VPDC; nor could we assess the timeliness of vaccination during pregnancy relative to gestational age. Missing data and the potential for vaccination status misclassification are also possible. Influenza and pertussis vaccination data were incorporated into the VPDC only in July 2015, and the quality of their collection has not been formally assessed.
Conclusions
We found that the uptake of pertussis vaccination by pregnant women in Victoria was high and increasing, but that uptake of influenza vaccination was moderate and variable. Differences related to hospital‐ and individual‐level factors were identified, indicating that many women and their infants are still at risk of these infections.
Preventing influenza and pertussis in pregnant women and infants remains a global challenge. Multimodal prevention strategies are required, particularly for women who have not been vaccinated during pregnancy. For preventing pertussis, cocoon immunisation of women and others likely to have direct contact with infants in the immediate post partum period may offer limited protection,24 and recent findings suggest a complementary role for pertussis vaccination at birth.25 Nevertheless, maternal vaccination remains the most effective strategy for preventing influenza and pertussis in pregnant women and their infants, and embedding its delivery into antenatal care pathways should be a priority.
Box 1 – Pregnancies ending in Victoria between July 2015 and June 2017, by capability level of hospital
|
Capability level |
Pregnancies |
Hospitals |
|||||||||||||
|
|
|||||||||||||||
|
Public hospitals |
117 725 (76.2%) |
51 (76%) |
|||||||||||||
|
Level 2 |
911 (0.6%) |
11 (16%) |
|||||||||||||
|
Level 3 |
19 885 (12.9%) |
19 (28%) |
|||||||||||||
|
Level 4 |
20 836 (13.5%) |
9 (13%) |
|||||||||||||
|
Level 5 |
41 212 (26.8%) |
9 (13%) |
|||||||||||||
|
Level 6 |
34 431 (22.4%) |
3 (4%) |
|||||||||||||
|
Private hospitals |
36 427 (23.7%) |
15 (22%) |
|||||||||||||
|
Homebirth |
84 (< 0.1%) |
1 (1%) |
|||||||||||||
|
Missing data |
194 (0.1%) |
— |
|||||||||||||
|
Total |
153 980 |
67 |
|||||||||||||
|
|
|||||||||||||||
|
|
|||||||||||||||
Box 2 – Vaccination of women in Victoria who had pregnancies that ended between July 2015 and June 2017, by month in which pregnancy ended. A, influenza; B, pertussis
Box 3 – Vaccination of women in Victoria who had pregnancies that ended during July 2016 – June 2017, by hospital. A, influenza; B, pertussis
Box 4 – Vaccination status and factors associated with uptake of influenza vaccination by 79 310 women in Victoria who had pregnancies that ended during 1 January 2016 – 31 December 2016
|
Characteristic |
Vaccination status |
Odds ratio* |
P |
Adjusted odds ratio* (95% CI) |
P |
||||||||||
|
Vaccinated |
Not vaccinated |
Missing data |
|||||||||||||
|
|
|||||||||||||||
|
Number of women |
31 925 (40.3%) |
40 590 (51.2%) |
6795 (8.6%) |
|
|
|
|
||||||||
|
Age (years) |
|||||||||||||||
|
< 20 |
357 (30.5%) |
728 (62.3%) |
84 (7.2%) |
1 |
|
1 |
|
||||||||
|
20–34 |
23 209 (40.0%) |
29 937 (51.6%) |
4889 (8.4%) |
1.58 (1.39–1.80) |
< 0.001 |
1.31 (1.15–1.50) |
< 0.001 |
||||||||
|
≥ 35 |
8359 (41.6%) |
9922 (49.4%) |
1819 (9.0%) |
1.72 (1.51–1.96) |
< 0.001 |
1.35 (1.18–1.56) |
< 0.001 |
||||||||
|
Missing data |
0 |
3 (50%) |
3 (50%) |
— |
|
— |
|
||||||||
|
Indigenous status |
|||||||||||||||
|
Not Indigenous |
31 491 (40.4%) |
39 782 (51.0%) |
6677 (8.6%) |
1 |
|
1 |
|
||||||||
|
Indigenous |
369 (33.3%) |
680 (61.4%) |
58 (5.2%) |
0.69 (0.60–0.78) |
< 0.001 |
0.91 (0.80–1.04) |
0.17 |
||||||||
|
Missing data |
65 (26%) |
128 (50.6%) |
60 (24%) |
0.64 (0.48–0.86) |
0.004 |
0.75 (0.54–1.02) |
0.07 |
||||||||
|
Country of birth |
|||||||||||||||
|
Australia |
20 420 (41.8%) |
25 084 (51.4%) |
3321 (6.8%) |
1 |
|
1 |
|
||||||||
|
Overseas |
11 382 (37.9%) |
15 283 (50.8%) |
3404 (11.3%) |
0.91 (0.89–0.94) |
< 0.001 |
0.91 (0.88–0.94) |
< 0.001 |
||||||||
|
Missing data |
123 (29.6%) |
223 (53.6%) |
70 (17%) |
0.68 (0.54–0.85) |
0.001 |
0.83 (0.66–1.04) |
0.10 |
||||||||
|
Area of residence |
|||||||||||||||
|
Metropolitan |
24 423 (39.8%) |
30 623 (49.9%) |
6286 (10.2%) |
1 |
|
1 |
|
||||||||
|
Rural |
6849 (42.0%) |
8992 (55.2%) |
447 (2.7%) |
0.96 (0.92–0.99) |
0.011 |
1.15 (1.10–1.20) |
< 0.001 |
||||||||
|
Missing data |
653 (38.6%) |
975 (57.7%) |
62 (3.7%) |
0.84 (0.76–0.93) |
0.001 |
0.88 (0.79–0.98) |
0.017 |
||||||||
|
Socio‐economic status (IRSD quintile) |
|||||||||||||||
|
1 (most disadvantaged) |
5575 (35.1%) |
8852 (55.8%) |
1450 (9.1%) |
1 |
|
1 |
|
||||||||
|
2 |
6241 (39.2%) |
8415 (52.8%) |
1279 (8.0%) |
1.18 (1.12–1.23) |
< 0.001 |
1.12 (1.07–1.18) |
< 0.001 |
||||||||
|
3 |
6181 (38.1%) |
8722 (53.8%) |
1301 (8.0%) |
1.13 (1.07–1.18) |
< 0.001 |
1.05 (1.00–1.11) |
0.039 |
||||||||
|
4 |
6440 (41.2%) |
7805 (50.0%) |
1372 (8.8%) |
1.31 (1.25–1.37) |
< 0.001 |
1.10 (1.04–1.16) |
0.001 |
||||||||
|
5 (least disadvantaged) |
7470 (47.8%) |
6773 (43.3%) |
1386 (8.9%) |
1.75 (1.67–1.84) |
< 0.001 |
1.34 (1.27–1.42) |
< 0.001 |
||||||||
|
Missing data |
18 (38%) |
23 (48%) |
7 (15%) |
1.24 (0.67–2.30) |
0.49 |
1.26 (0.66–2.37) |
0.48 |
||||||||
|
Marital status |
|||||||||||||||
|
Not partnered |
3040 (33.6%) |
5256 (58.2%) |
742 (8.2%) |
1 |
|
1 |
|
||||||||
|
Partnered (married/de facto) |
28 666 (41.2%) |
34 959 (50.3%) |
5932 (8.5%) |
1.42 (1.35–1.49) |
< 0.001 |
1.11 (1.05–1.17) |
< 0.001 |
||||||||
|
Missing data |
219 (30.6%) |
375 (52.4%) |
121 (16.9%) |
1.01 (0.85–1.20) |
0.91 |
0.97 (0.81–1.16) |
0.76 |
||||||||
|
Smoked at any time during pregnancy |
|||||||||||||||
|
Did not smoke |
30 381 (41.2%) |
36 973 (50.2%) |
6362 (8.6%) |
1 |
|
1 |
|
||||||||
|
Smoked |
1471 (28.1%) |
3440 (65.7%) |
325 (6.2%) |
0.52 (0.49–0.55) |
< 0.001 |
0.65 (0.61–0.70) |
< 0.001 |
||||||||
|
Missing data |
73 (20%) |
177 (49.4%) |
108 (30.2%) |
0.50 (0.38–0.66) |
< 0.001 |
0.70 (0.53–0.93) |
0.013 |
||||||||
|
Gravidity |
|||||||||||||||
|
Multigravida |
20 273 (37.9%) |
28 649 (53.6%) |
4507 (8.4%) |
1 |
|
1 |
|
||||||||
|
Primigravida |
11 652 (45.0%) |
11 939 (46.1%) |
2287 (8.8%) |
1.38 (1.34–1.42) |
< 0.001 |
1.37 (1.32–1.41) |
< 0.001 |
||||||||
|
Missing data |
0 |
2 (67%) |
1 (33%) |
— |
|
— |
|
||||||||
|
Plurality |
|||||||||||||||
|
Singleton |
31 492 (40.3%) |
40 017 (51.2%) |
6664 (8.5%) |
1 |
|
1 |
|
||||||||
|
Multiple birth |
433 (38.1%) |
573 (50.4%) |
131 (11.5%) |
0.96 (0.85–1.09) |
0.53 |
1.03 (0.90–1.17) |
0.71 |
||||||||
|
Discipline of antenatal care provider |
|||||||||||||||
|
Obstetrician |
17 442 (40.7%) |
21 484 (50.1%) |
3955 (9.2%) |
1 |
|
1 |
|
||||||||
|
No provider |
23 (9.9%) |
183 (78.9%) |
26 (11%) |
0.15 (0.10–0.24) |
< 0.001 |
0.26 (0.16–0.43) |
< 0.001 |
||||||||
|
General practitioner |
5101 (49.9%) |
4725 (46.2%) |
401 (3.9%) |
1.33 (1.27–1.39) |
< 0.001 |
1.57 (1.49–1.65) |
< 0.001 |
||||||||
|
Midwife |
9194 (36.0%) |
13 949 (54.7%) |
2371 (9.3%) |
0.81 (0.79–0.84) |
< 0.001 |
0.98 (0.94–1.02) |
0.30 |
||||||||
|
Missing data |
165 (36.2%) |
249 (54.6%) |
42 (9.2%) |
0.82 (0.67–0.99) |
0.044 |
0.97 (0.79–1.20) |
0.80 |
||||||||
|
Gestational age at first antenatal visit (weeks) |
|||||||||||||||
|
≥ 24 |
1469 (29.5%) |
2988 (60.0%) |
523 (10.5%) |
1 |
|
1 |
|
||||||||
|
12–23 |
14 540 (38.3%) |
20 179 (53.2%) |
3219 (8.5%) |
1.47 (1.37–1.57) |
< 0.001 |
1.36 (1.27–1.45) |
< 0.001 |
||||||||
|
≤ 11 |
15 727 (44.1%) |
17 023 (47.7%) |
2918 (8.2%) |
1.88 (1.76–2.01) |
< 0.001 |
1.63 (1.52–1.75) |
< 0.001 |
||||||||
|
Missing data |
189 (26.1%) |
400 (55.2%) |
135 (18.6%) |
0.96 (0.80–1.16) |
0.67 |
1.37 (1.09–1.72) |
< 0.001 |
||||||||
|
Hospital type |
|||||||||||||||
|
Private |
8541 (45.2%) |
8066 (42.7%) |
2304 (12.2%) |
1 |
|
1 |
|
||||||||
|
Public |
23 380 (38.8%) |
32 415 (53.9%) |
4399 (7.3%) |
0.68 (0.66–0.71) |
< 0.001 |
1.15 (1.09–1.22) |
< 0.001 |
||||||||
|
Missing data |
4 (2%) |
109 (53.2%) |
92 (45%) |
0.03 (0.01–0.09) |
0.047 |
0.05 (0.02–0.12) |
< 0.001 |
||||||||
|
Capability level of hospital of birth (public) |
|||||||||||||||
|
6 (highest capability) |
7760 (44.1%) |
7844 (44.6%) |
1988 (11.3%) |
1 |
|
1 |
|
||||||||
|
5 |
7237 (34.2%) |
12 875 (60.8%) |
1074 (5.1%) |
0.57 (0.54–0.59) |
< 0.001 |
0.58 (0.55–0.61) |
< 0.001 |
||||||||
|
4 |
4051 (37.4%) |
5728 (52.9%) |
1047 (9.7%) |
0.71 (0.68–0.75) |
0.024 |
0.64 (0.61–0.68) |
< 0.001 |
||||||||
|
3 |
4160 (41.1%) |
5777 (57.0%) |
196 (1.9%) |
0.73 (0.69–0.77) |
0.037 |
0.67 (0.63–0.71) |
< 0.001 |
||||||||
|
2 |
172 (37.6%) |
191 (41.8%) |
94 (20.6%) |
0.91 (0.74–1.12) |
|
0.67 (0.54–0.84) |
< 0.001 |
||||||||
|
Private hospital |
8541 (45.2%) |
8066 (42.7%) |
2304 (12.2%) |
1.07 (1.02–1.12) |
0.13 |
— |
— |
||||||||
|
Missing data |
4 (2%) |
109 (53.2%) |
92 (45%) |
0.04 (0.01–0.10) |
< 0.001 |
0.04 (0.01–0.11) |
< 0.001 |
||||||||
|
Gestational age at birth (weeks) |
|||||||||||||||
|
< 28 |
55 (12%) |
308 (68.0%) |
90 (20%) |
1 |
|
1 |
|
||||||||
|
28–36 |
1957 (36.1%) |
2865 (52.9%) |
598 (11.0%) |
3.83 (2.85–5.13) |
< 0.001 |
4.13 (3.07–5.56) |
< 0.001 |
||||||||
|
≥ 37 |
29 913 (40.7%) |
37 417 (51.0%) |
6107 (8.3%) |
4.48 (3.36–5.97) |
< 0.001 |
4.74 (3.54–6.35) |
< 0.001 |
||||||||
|
|
|||||||||||||||
|
IRSD = Index of Relative Socioeconomic Disadvantage. * Adjusted odds ratios are adjusted for all other factors in the table. Missing data were excluded from odds ratio calculations. ◆ |
|||||||||||||||
Box 5 – Vaccination status and factors associated with uptake of pertussis vaccination by 78 887 women in Victoria who had pregnancies of at least 28 weeks’ gestation that ended during 1 January 2016 – 31 December 2016
|
Characteristic |
Vaccination status |
Odds ratio* |
P |
Adjusted odds ratio* (95% CI) |
P |
||||||||||
|
Vaccinated |
Not vaccinated |
Missing data |
|||||||||||||
|
|
|||||||||||||||
|
Number of women |
51 024 (64.7%) |
19 292 (24.5%) |
8541 (10.8%) |
|
|
|
|
||||||||
|
Age (years) |
|||||||||||||||
|
< 20 |
713 (61.5%) |
361 (31.1%) |
85 (7.3%) |
1 |
|
1 |
|
||||||||
|
20–34 |
37 933 (65.7%) |
13 941 (24.2%) |
5845 (10.1%) |
1.38 (1.21–1.57) |
< 0.001 |
1.42 (1.23–1.63) |
< 0.001 |
||||||||
|
≥ 35 |
12 378 (62.0%) |
4987 (25.0%) |
2608 (13.1%) |
1.26 (1.10–1.43) |
0.001 |
1.34 (1.16–1.55) |
< 0.001 |
||||||||
|
Missing data |
0 |
3 (50%) |
3 (50%) |
|
|
|
|
||||||||
|
Indigenous status |
|||||||||||||||
|
Not Indigenous |
50 250 (64.8%) |
18 834 (24.3%) |
8420 (10.9%) |
1 |
|
1 |
|
||||||||
|
Indigenous |
650 (59.0%) |
390 (35.4%) |
62 (5.6%) |
0.62 (0.55–0.71) |
< 0.001 |
0.69 (0.60–0.79) |
< 0.001 |
||||||||
|
Missing data |
124 (49.4%) |
68 (27%) |
59 (24%) |
0.68 (0.51–0.92) |
0.012 |
0.95 (0.68–1.32) |
0.76 |
||||||||
|
Country of birth |
|||||||||||||||
|
Australia |
33 398 (68.8%) |
10 572 (21.8%) |
4586 (9.4%) |
1 |
|
1 |
|
||||||||
|
Overseas |
17 428 (58.3%) |
8578 (28.7%) |
3881 (13.0%) |
0.64 (0.62–0.67) |
< 0.001 |
0.68 (0.65–0.70) |
< 0.001 |
||||||||
|
Missing data |
198 (47.8%) |
142 (34.3%) |
74 (18%) |
0.44 (0.36–0.55) |
< 0.001 |
0.59 (0.47–0.74) |
< 0.001 |
||||||||
|
Area of residence |
|||||||||||||||
|
Metropolitan |
37 325 (61.2%) |
15 715 (25.8%) |
7949 (13.0%) |
1 |
|
1 |
|
||||||||
|
Rural |
12 431 (76.8%) |
3227 (19.9%) |
528 (3.3%) |
1.62 (1.55–1.69) |
< 0.001 |
1.87 (1.77–1.97) |
< 0.001 |
||||||||
|
Missing data |
1268 (75.4%) |
350 (20.8%) |
64 (3.8%) |
1.53 (1.35–1.72) |
< 0.001 |
1.52 (1.34–1.73) |
< 0.001 |
||||||||
|
Socio‐economic status (IRSD quintile) |
|||||||||||||||
|
1 (most disadvantaged) |
9680 (61.4%) |
4585 (29.1%) |
1499 (9.5%) |
1 |
|
|
|
||||||||
|
2 |
10 284 (64.9%) |
4153 (26.2%) |
1404 (8.9%) |
1.17 (1.12–1.23) |
< 0.001 |
1.22 (1.15–1.29) |
< 0.001 |
||||||||
|
3 |
10 358 (64.3%) |
4092 (25.4%) |
1660 (10.3%) |
1.20 (1.14–1.26) |
< 0.001 |
1.30 (1.23–1.37) |
< 0.001 |
||||||||
|
4 |
10 402 (67.0%) |
3425 (22.1%) |
1699 (10.9%) |
1.44 (1.37–1.52) |
< 0.001 |
1.57 (1.48–1.66) |
< 0.001 |
||||||||
|
5 (least disadvantaged) |
10 269 (66.0%) |
3027 (19.4%) |
2272 (14.6%) |
1.61 (1.52–1.70) |
< 0.001 |
1.77 (1.66–1.89) |
< 0.001 |
||||||||
|
Missing data |
31 (65%) |
10 (21%) |
7 (15%) |
1.47 (0.72–3.00) |
0.29 |
1.38 (0.65–2.92) |
0.40 |
||||||||
|
Marital status |
|||||||||||||||
|
Not partnered |
5476 (61.1%) |
2715 (30.3%) |
768 (8.6%) |
1 |
|
1 |
|
||||||||
|
Partnered (married/de facto) |
45 177 (65.3%) |
16 400 (23.7%) |
7613 (11.0%) |
1.37 (1.30–1.43) |
< 0.001 |
1.18 (1.12–1.25) |
< 0.001 |
||||||||
|
Missing data |
371 (52.4%) |
177 (25.0%) |
160 (22.6%) |
1.04 (0.86–1.25) |
0.68 |
1.00 (0.82–1.22) |
0.99 |
||||||||
|
Smoked at any time during pregnancy |
|||||||||||||||
|
Did not smoke |
47 831 (65.2%) |
17 394 (23.7%) |
8092 (11.0%) |
1 |
|
1 |
|
||||||||
|
Smoked |
3061 (58.9%) |
1802 (34.7%) |
330 (6.4%) |
0.62 (0.58–0.66) |
< 0.001 |
0.69 (0.65–0.74) |
< 0.001 |
||||||||
|
Missing data |
132 (38.0%) |
96 (28%) |
119 (34.3%) |
0.50 (0.38–0.65) |
< 0.001 |
0.64 (0.48–0.86) |
0.003 |
||||||||
|
Gravidity |
|||||||||||||||
|
Multigravida |
32 846 (61.8%) |
14 648 (27.6%) |
5638 (10.6%) |
1 |
|
1 |
|
||||||||
|
Primigravida |
18 178 (70.7%) |
4642 (18.0%) |
2902 (11.3%) |
1.75 (1.68–1.81) |
< 0.001 |
1.80 (1.73–1.87) |
< 0.001 |
||||||||
|
Missing data |
0 |
2 (67%) |
1 (33%) |
|
|
|
|
||||||||
|
Plurality |
|||||||||||||||
|
Singleton |
50 393 (64.8%) |
19 007 (24.4%) |
8384 (10.8%) |
1 |
|
1 |
|
||||||||
|
Multiple birth |
631 (58.8%) |
285 (26.6%) |
157 (14.6%) |
0.84 (0.73–0.96) |
0.012 |
1.00 (0.86–1.16) |
0.98 |
||||||||
|
Discipline of antenatal care provider |
|||||||||||||||
|
Obstetrician |
26 672 (62.7%) |
10 137 (23.8%) |
5730 (13.5%) |
1 |
|
1 |
|
||||||||
|
No provider |
59 (27%) |
139 (63.2%) |
22 (10%) |
0.16 (0.12–0.22) |
< 0.001 |
0.36 (0.24–0.53) |
< 0.001 |
||||||||
|
General practitioner |
8047 (78.9%) |
1771 (17.4%) |
383 (3.8%) |
1.73 (1.63–1.83) |
< 0.001 |
1.49 (1.40–1.58) |
< 0.001 |
||||||||
|
Midwife |
15 965 (62.7%) |
7120 (28.0%) |
2363 (9.3%) |
0.85 (0.82–0.88) |
< 0.001 |
0.97 (0.93–1.01) |
0.14 |
||||||||
|
Missing data |
281 (62.6%) |
125 (27.8%) |
43 (9.6%) |
0.85 (0.69–1.06) |
0.15 |
1.12 (0.89–1.40) |
0.35 |
||||||||
|
Gestational age at first antenatal visit (weeks) |
|||||||||||||||
|
≥ 24 |
2646 (53.6%) |
1774 (35.9%) |
516 (10.5%) |
1 |
|
1 |
|
||||||||
|
12–23 |
24 535 (65.0%) |
9938 (26.3%) |
3246 (8.6%) |
1.66 (1.55–1.77) |
< 0.001 |
1.50 (1.40–1.61) |
< 0.001 |
||||||||
|
≤ 11 |
23 544 (66.3%) |
7322 (20.6%) |
4650 (13.1%) |
2.16 (2.02–2.30) |
< 0.001 |
1.83 (1.70–1.97) |
< 0.001 |
||||||||
|
Missing data |
299 (43.6%) |
258 (37.6%) |
129 (18.8%) |
0.78 (0.65–0.93) |
0.005 |
1.08 (0.85–1.38) |
0.53 |
||||||||
|
Hospital type |
|||||||||||||||
|
Private |
11061 (58.7%) |
3692 (19.6%) |
4100 (21.7%) |
1 |
|
1 |
|
||||||||
|
Public |
39 946 (66.8%) |
15 504 (25.9%) |
4349 (7.3%) |
0.86 (0.82–0.90) |
< 0.001 |
1.37 (1.28–1.46) |
< 0.001 |
||||||||
|
Missing data |
17 (8.3%) |
96 (47%) |
92 (45%) |
0.06 (0.04–0.10) |
< 0.001 |
0.07 (0.04–0.12) |
< 0.001 |
||||||||
|
Capability level of hospital of birth (public) |
|||||||||||||||
|
6 (highest capability) |
11 377 (65.6%) |
4054 (23.4%) |
1902 (11.0%) |
1 |
|
1 |
|
||||||||
|
5 |
13 200 (62.5%) |
6855 (32.5%) |
1053 (5.0%) |
0.69 (0.66–0.72) |
< 0.001 |
0.64 (0.61–0.68) |
< 0.001 |
||||||||
|
4 |
7368 (68.3%) |
2319 (21.5%) |
1104 (10.2%) |
1.13 (1.07–1.20) |
< 0.001 |
0.85 (0.79–0.91) |
< 0.001 |
||||||||
|
3 |
7693 (76.1%) |
2222 (22.0%) |
196 (1.9%) |
1.23 (1.16–1.31) |
< 0.001 |
1.12 (1.05–1.19) |
< 0.001 |
||||||||
|
2 |
308 (67.5%) |
54 (12%) |
94 (21%) |
2.03 (1.52–2.72) |
< 0.001 |
1.10 (0.81–1.49) |
0.53 |
||||||||
|
Private hospital |
11 061 (58.7%) |
3692 (19.6%) |
4100 (21.7%) |
1.07 (1.01–1.12) |
0.013 |
— |
|
||||||||
|
Missing data |
17 (8.3%) |
96 (47%) |
92 (45%) |
0.06 (0.04–0.11) |
< 0.001 |
0.04 (0.03–0.08) |
< 0.001 |
||||||||
|
Gestational age at birth (weeks) |
|||||||||||||||
|
28–36 |
3056 (56.4%) |
1664 (30.7%) |
700 (12.9%) |
1 |
|
1 |
|
||||||||
|
≥ 37 |
47 968 (65.3%) |
17 628 (24.0%) |
7841 (10.7%) |
1.48 (1.39–1.58) |
< 0.001 |
1.42 (1.33–1.52) |
< 0.001 |
||||||||
|
|
|||||||||||||||
|
IRSD = Index of Relative Socioeconomic Disadvantage. * Adjusted odds ratios are adjusted for all other factors in the table. Missing data were excluded from odds ratio calculations. ◆ |
|||||||||||||||
Box 6 – Recommendations for practice
- All antenatal care providers should offer maternal vaccinations according to national recommendations during each pregnancy, regardless of the interval between pregnancies
- The influenza vaccine can be given at any time during pregnancy, but preferably before the influenza season
- The pertussis vaccine should be given during the third trimester, preferably between 28 and 32 weeks’ gestation
- Maternal vaccinations should be offered to all pregnant women, particularly women from groups in which rates are currently relatively low: Aboriginal and Torres Strait Islander women, women born overseas, and women who smoke
- Maternal vaccination should be embedded in all antenatal care pathways, and systems should be improved to increase the uptake of vaccination by pregnant women
Received 5 November 2018, accepted 24 January 2019
- Stacey L Rowe1,2
- Kirsten P Perrett3
- Rosemary Morey2
- Nicola Stephens4
- Benjamin C Cowie5,6
- Terry M Nolan3,7
- Karin Leder1,6
- Helen Pitcher2
- Brett Sutton2
- Allen C Cheng1
- 1 Monash University, Melbourne, VIC
- 2 Department of Health and Human Services (Victoria), Melbourne, VIC
- 3 Murdoch Children's Research Institute, Melbourne, VIC
- 4 University of Tasmania, Hobart, TAS
- 5 WHO Collaborating Centre for Viral Hepatitis, the Peter Doherty Institute for Infection and Immunity, Melbourne, VIC
- 6 Victorian Infectious Diseases Service, Royal Melbourne Hospital, Melbourne, VIC
- 7 University of Melbourne, Melbourne, VIC
We are grateful to the Consultative Council on Obstetric and Perinatal Morbidity and Mortality (CCOPMM) for providing access to the de‐identified data analysed in this study and for the assistance of the staff at the Consultative Councils Unit, Safer Care Victoria, particularly Shirin Anil, Mary‐Ann Davey and Jeremy Oats. The conclusions, findings, opinions and views or recommendations expressed in this article are those of the authors, and do not necessarily reflect those of CCOPMM. We gratefully acknowledge the assistance of Qing Ng Ning, Andrew Senangsayah, Mark Sipthorp, Paul Schollum, Rana Bose and Kathleen Bapaume with data extraction and preparation. We also thank Stephen Pellissier, Simon Crouch, Lucinda Franklin and Janet Strachan of the Health Protection Branch for their contributions to the planning of this study. Finally, we gratefully acknowledge the midwives and antenatal care providers who are working to deliver maternal vaccination programs to pregnant women in Victoria, and for their work in collecting the data captured in the VPDC.
No relevant disclosures.
- 1. World Health Organization. Vaccines against influenza. WHO position paper: November 2012. Wkly Epidemiol Rec 2012; 47: 461–476.
- 2. Australian Technical Advisory Group on Immunisation (ATAGI). The Australian immunisation handbook, 10th edition. Canberra: Australian Department of Health, 2017 update. https://immunisationhandbook.health.gov.au (viewed Sept 2018).
- 3. Galvao TF, Silva MT, Zimmermann IR, et al. Influenza vaccination in pregnant women: a systematic review. ISRN Prev Med 2013; 2013: 879493.
- 4. Bratton KN, Wardle MT, Orenstein WA, Omer SB. Maternal influenza immunization and birth outcomes of stillbirth and spontaneous abortion: a systematic review and meta‐analysis. Clin Infect Dis 2015; 60: e11–e19.
- 5. Amirthalingam G, Campbell H, Ribeiro S, et al. Sustained effectiveness of the maternal pertussis immunization program in England 3 years following introduction. Clin Infect Dis 2016; 63 (Suppl 4): S236–S243.
- 6. Public Health England. Pertussis vaccination programme for pregnant women update: vaccine coverage in England, April to June 2017 (HPR 11[34]). Sep 2017. https://assets.publishing.service.gov.uk/government/uploads/system/uploads/attachment_data/file/655330/hpr3417_prntl-prtsss-VC.pdf (viewed Nov 2018).
- 7. Centers for Disease Control and Prevention. Maternal vaccination coverage. Updated Aug 2017. https://www.cdc.gov/vaccines/pregnancy/hcp-toolkit/maternal-vaccination-coverage.html (viewed July 2018).
- 8. Public Health England. Seasonal influenza vaccine uptake in GP patients: winter 2017 to 2018 (PHE 2018093). May 2018. https://www.gov.uk/government/statistics/seasonal-flu-vaccine-uptake-in-gp-patients-winter-2017-to-2018 (viewed Sept 2018).
- 9. Australian Technical Advisory Group on Immunisation (ATAGI). ATAGI clinical advice for immunisation providers regarding maternal vaccination through the National Immunisation Program (NIP). Updated 25 June 2018. https://beta.health.gov.au/resources/publications/atagi-clinical-advice-for-immunisation-providers-regarding-maternal (viewed Sept 2018).
- 10. Flood MM, McDonald SJ, Pollock WE, Davey M‐A. Data accuracy in the Victorian Perinatal Data Collection: results of a validation study of 2011 data. Health Inf Manag 2017; 46: 113–126.
- 11. Parliament of Victoria. Births, Deaths and Marriages Registration Act 1996. http://www5.austlii.edu.au/au/legis/vic/consol_act/bdamra1996383/index.html (viewed Sept 2018).
- 12. Department of Health (Victoria). Capability framework for Victorian maternity and newborn services. Melbourne: Department of Health, 2010. https://www2.health.vic.gov.au/about/publications/policiesandguidelines/Capability-framework-for-Victorian-maternity-and-newborn-services (viewed Sept 2018).
- 13. Akaike H. Information theory and an extension of the maximum likelihood principle. In: Parzen E, Tanabe K, Kitagawa G, editors. Selected papers of Hirotugu Akaike. New York: Springer, 1998; pp. 199–213.
- 14. Mosby LG, Rasmussen SA, Jamieson DJ. 2009 pandemic influenza A (H1N1) in pregnancy: a systematic review of the literature. Am J Obstet Gynecol 2011; 205: 10–18.
- 15. Wiley KE, Cooper SC, Wood N, Leask J. Understanding pregnant women's attitudes and behavior toward influenza and pertussis vaccination. Qual Health Res 2015; 25: 360–370.
- 16. Maher L, Dawson A, Wiley K, et al. Influenza vaccination during pregnancy: a qualitative study of the knowledge, attitudes, beliefs, and practices of general practitioners in Central and South‐Western Sydney. BMC Fam Pract 2014; 15: 102.
- 17. Krishnaswamy S, Wallace EM, Buttery J, Giles ML. Strategies to implement maternal vaccination: a comparison between standing orders for midwife delivery, a hospital based maternal immunisation service and primary care. Vaccine 2018; 36: 1796–1800.
- 18. McCarthy EA, Pollock WE, Nolan T, et al. Improving influenza vaccination coverage in pregnancy in Melbourne 2010–2011. Aust N Z J Obstet Gynaecol 2012; 52: 334–341.
- 19. Winters BD, Gurses AP, Lehmann H, et al. Clinical review: checklists: translating evidence into practice. Crit Care 2009; 13: 210.
- 20. O'Grady K‐AF, Dunbar M, Medlin LG, et al. Uptake of influenza vaccination in pregnancy amongst Australian Aboriginal and Torres Strait Islander women: a mixed‐methods pilot study. BMC Res Notes 2015; 8: 169.
- 21. Lotter K, Regan AK, Thomas T, et al. Antenatal influenza and pertussis vaccine uptake among Aboriginal mothers in Western Australia. Aust N Z J Obstet Gynaecol 2018; 58: 417–424.
- 22. Ganle JK, Parker M, Fitzpatrick R, Otupiri E. Inequities in accessibility to and utilisation of maternal health services in Ghana after user‐fee exemption: a descriptive study. Int J Equity Health 2014; 13: 89.
- 23. MacDougall DM, Halperin SA. Improving rates of maternal immunization: challenges and opportunities. Hum Vaccin Immunother 2016; 12: 857–885.
- 24. Rowe SL, Tay EL, Franklin LJ, et al. Effectiveness of parental cocooning as a vaccination strategy to prevent pertussis infection in infants: a case–control study. Vaccine 2018; 36: 2012–2019.
- 25. Wood N, Nolan T, Marshall H, et al. Immunogenicity and safety of monovalent acellular pertussis vaccine at birth: a randomized clinical trial. JAMA Pediatr 2018; 172: 1045–1052.
Abstract
Objectives: To assess variations by time of year and hospital in the uptake of influenza and pertussis vaccinations by pregnant women in Victoria; to identify factors associated with vaccination uptake.
Design, setting: Retrospective analysis of data in the Victorian Perinatal Data Collection (VPDC), a population surveillance system for obstetric conditions, procedures, and pregnancy and birth outcomes.
Participants: Women whose pregnancies ended in a live or stillbirth during July 2015 – June 2017.
Main outcome measures: Influenza and pertussis vaccinations during pregnancy.
Results: 153 980 pregnancies in 67 hospitals ended during July 2015 – June 2017; 59 968 pregnant women (39.0%) were vaccinated against influenza and 98 583 (64.0%) against pertussis. Coverage varied by pregnancy end date, rising for influenza during winter and spring, but for pertussis rising continuously across the two years from 37.5% to 82.2%. Differences between hospitals in coverage were marked. Factors associated with vaccination included greater maternal age, primigravidity, early antenatal care, and GP‐led care. The odds of vaccination were statistically significantly lower for women born overseas and those who smoked during pregnancy; the odds of vaccination were also lower for Aboriginal and Torres Strait Islander women.
Conclusions: Pertussis vaccination of pregnant women in Victoria has increased, but influenza vaccination rates remain moderate and variable. Structural changes at the system level may improve maternal vaccination rates. Embedding the delivery of maternal vaccination programs in antenatal care pathways should be a priority.