


The known High income countries with high levels of immigration are challenged by the greater risk of stillbirth among migrants and women from non-white ethnic backgrounds. In contrast to antepartum stillbirth, little is known about the association between ethnic and migration background and intrapartum stillbirth.
The new Stillbirth was more frequent among women with non-white backgrounds born overseas, particularly among women with African or Indian backgrounds, than for Australian-born women.
The implications Further investigation of stillbirth in migrant women, particularly those of Indian or African background, is required for developing strategies for averting preventable stillbirths.
More than 2.6 million stillbirths were reported around the world in 2015.1 Stillbirth challenges families, societies, practitioners, and health care systems,2,3 but its scientific investigation only recently gained momentum, after the Lancet launched two stillbirth article series in 2011 and 2016.4,5 Almost 98% of stillbirths are in low and middle income countries, but they also occur in high income countries, where socio-economic factors influence the prevalence of stillbirth.6,7 International migration is at its highest level since the Second World War, and 64% of migrants live in high income countries.8 Migrants and women from non-white ethnic backgrounds generally have more stillbirths than white migrants and non-migrant women.9-13
Immigration is the principal component of population growth in Australia; in 2016, 35% of residents had been born overseas,14 and 33% of women who gave birth during 2015 had been born overseas.15 Western Australia recorded the greatest population growth of all Australian states and territories during 2006–2016 (24.8% increase),16 and 62% of Western Australians have at least one overseas-born parent.17
About 50% of stillbirths around the world are intrapartum stillbirths, deemed preventable by good obstetric care. The prevalence of intrapartum stillbirths is lower in high income countries, but in some countries constitute almost 20% of stillbirths; this is significant, as their prevalence is related to quality of care.6 Women of non-white ethnic background, particularly African and Asian women, are at greater risk of antepartum stillbirth than white women.10-12 However, the only published study of intrapartum stillbirth was a prospective study that found higher crude rates and odds of intrapartum stillbirth for black women in the United Kingdom (1988–2000).18 Data on the timing of death is scarce, posing significant challenges for preventive strategies in clinical practice.7
We aimed to estimate ethnic group-specific prevalence rates to determine the association between maternal country of birth and ethnic origin and the risk of ante- and intrapartum stillbirth in a whole population sample of WA births (2005–2013).
Methods
Study design and participants
A whole population retrospective cohort analysis of de-identified, linked routinely collected data for all births to non-Indigenous women in WA during 1 January 2005 – 31 December 2013 was undertaken.
Data sources and linkage
The Western Australia Data Linkage System (WADLS) applies probabilistic matching based on full name and address, phonetic compression algorithms, and other identifiers to link data from a variety of health and other administrative datasets.19 Geocoding with address parsing software assigns residential addresses to census statistical areas to determine their Index of Relative Socio-economic Disadvantage (IRSD), an Australian Bureau of Statistics-developed measure of socio-economic status that summarises a range of information about the economic and social conditions of people and households in an area.20 The estimated frequency of invalid or missed links based on evaluation of linked chains is very low (0.11%), and the linkage procedures are widely accepted as best practice.21,22
The primary data source was the Midwives’ Notification System (MNS), a highly reliable statutory data collection of demographic, pregnancy and delivery information for all births in WA.23 MNS data were supplemented by data from other WA statutory data collections: the Hospital Morbidity Data Collection (information related to inpatient discharges from all hospitals), the WA Registry of Developmental Anomalies (WARDA; developmental anomalies identified by 6 years of age, including in fetuses of terminated pregnancies), and Birth and Death Registrations. Genealogical linkage (by the WADLS Family Connections Linkage Facility) was also undertaken.
Exposures
Maternal ethnic background (“ethnic origin”: the ethnic background with which the woman identifies) is recorded in the MNS as Caucasian (white), Aboriginal/Torres Strait Islander, Asian, Indian, African, Māori, Polynesian, or other. As our study focused on migrants, data for women of Aboriginal or Torres Strait Islander heritage, among whom the prevalence of stillbirth is twice that of non-Indigenous Australians,24 were excluded to avoid non-differential misclassification bias toward the null hypothesis. Women of Polynesian origin (289 women, 0.1%) were included in the “other” group.
“Migrant status” (Australian- or overseas-born) was based on the mother’s place of birth (complete for 99% of the births) in birth registration data; this information was merged with MNS data. “Country of birth” in the mother’s hospital record was also used for validation and to retrieve missing values. Migrant group was stratified by ethnic origin, complete for 99.99% of the population.
Outcomes
Stillbirth is defined as death of a baby of at least 20 completed weeks’ gestation before complete expulsion or extraction from the mother.16 Death before labour commences is termed antepartum stillbirth; after labour commences, intrapartum stillbirth.6
“Status of baby at birth” (MNS data) was used to identify livebirths and stillbirths. Type of stillbirth was reported as ante- or intrapartum for 80% of stillbirths in MNS data; information on the presence or absence of the fetal heartbeat at the start of labour was obtained from death certificates. Consequently, the type of stillbirth was available for 99.98% of stillbirths. Terminations of pregnancy, identified in WARDA and death records, were excluded (433 cases).
Statistical analysis
All analyses were performed in Stata 13.1 (StataCorp). Demographic and obstetric characteristics were tabulated by ethnic group and Pearson χ2 or Fisher exact tests employed as appropriate in descriptive analyses. Prevalence rates per 1000 total births of at least 20 weeks gestational age of all, antepartum, and intrapartum stillbirths during 2005–2013 were calculated; prevalence rates per 10 000 total births were calculated specifically for term/post-term stillbirths. The migrant populations of women, stratified into white, Asian, Indian, African, Māori, and “other”, were compared with the Australian-born population. Crude odds ratios (ORs) with 95% confidence intervals (CIs) were estimated by univariate logistic regression for overall, antepartum, and intrapartum stillbirths; P < 0.05 was deemed statistically significant. Covariates — established and clinically plausible risk factors significant in the univariate analysis — were selected a priori. The multivariable logistic regression analysis was adjusted for previous stillbirth, year of birth, maternal age group, sex of baby, marital status, pregnancy complications, medical conditions, smoking during pregnancy, parity, plurality, and IRSD. IRSD data were missing for 3.3% of women, who were categorised as a separate subgroup to retain all cases in the analysis. Migrants’ countries of birth were further assigned to United Nations geographic regions — South Asia (India, Pakistan, Sri Lanka, Afghanistan, Bangladesh), South East and East Asia (Vietnam, Malaysia, Indonesia, China, Japan), Middle East (Iraq, Israel, Jordan, Turkey, Yemen, Cyprus), other Asia, Oceania, Africa, Europe, and the Americas — and data for these regions compared with the combined data for Australia and New Zealand.
Two sensitivity analyses were undertaken: the first excluded women with more than one birth record in the dataset, to examine the effect of non-independence that can affect the analysis of large perinatal datasets;13 the second excluded stillbirths of fetuses with major congenital anomalies, as the mortality associated with congenital anomalies is higher for babies of women from some ethnic backgrounds, perhaps because of restricted access or differing attitudes to screening and termination of pregnancy.25
Ethics approval
The Human Research Ethics Committee of the WA Department of Health approved this study (reference, 2015/23).
Results
There were 260 997 live and stillbirths to non-Indigenous women in WA during 2005–2013, including 172 571 births (66.1%) to Australian-born and 88 395 (33.9%) to migrant mothers (Box 1).
Migrant mothers were generally slightly older than Australian-born women; the proportion who smoked during pregnancy was greater for Australian-born mothers (14%) than for most migrant groups (1–9%; exception: Māori women, 39%). The proportion of women who were multiparous was highest for African migrants (43.9%), as were the proportions of extremely pre-term (20–27 weeks) births (1.3%) and post-term (≥ 42 weeks) pregnancies (2.1%). The proportions of women in the least disadvantaged IRSD quintile were largest for migrant women with white and Asian backgrounds (Box 2).
About 24% of stillbirths were intrapartum stillbirths (Box 1). Among Australian-born women there were 4.7 stillbirths (3.5 antepartum, 1.1 intrapartum) per 1000 births; among overseas-born women there were 5.7 stillbirths (4.0 antepartum, 1.5 intrapartum) per 1000 births. The highest prevalence of stillbirth was among African migrant women (12.3 stillbirths, 7.5 antepartum stillbirths, 4.8 intrapartum stillbirths per 1000 total births) (Box 3).
Non-white migrant women were more likely than white migrants to have stillbirths (OR, 1.42; 95% CI, 1.19–1.70), antepartum stillbirths (OR, 1.45; 95% CI, 1.18–1.79), and intrapartum stillbirths (OR, 1.58; 95% CI, 1.12–2.24). There were no significant differences between Australian-born women with white and non-white backgrounds for any type of stillbirth (online Appendix, table 1). Women born overseas were more likely to have a stillbirth (adjusted odds ratio [aOR], 1.26; 95% CI, 1.09–1.37), antepartum stillbirth (aOR, 1.20; 95% CI, 1.02–1.33), or intrapartum stillbirth (aOR, 1.38, 95% CI, 1.09–1.72) than Australian-born women (Box 4).
Antepartum stillbirth was associated with African (v Australian-born women: aOR, 2.12; 95% CI, 1.46–3.08), Indian (aOR, 1.71; 95% CI, 1.17–2.47) and “other” ethnic origins (aOR, 1.43; 95% CI, 1.06–1.93) after adjusting for a range of covariates. Intrapartum stillbirth was associated with African (aOR, 5.08; 95% CI, 3.14–8.22) and “other” ethnic backgrounds (aOR, 1.86; 95% CI, 1.15–3.00) after adjusting for a range of covariates (Box 4).
The influence of African or Indian ethnic origin on the likelihood of stillbirth was similar in both sensitivity analyses (data not shown).
It is notable that 71% of women in the “other” ethnic background category (MNS data) were born in Asia or Africa (birth registration data) but did not report their ethnic origin as Asian, Indian or African. Analysed by maternal geographic region of birth, women from Africa (aOR, 1.58; 95% CI, 1.22–2.05) and South Asia (aOR, 1.60; 95% CI, 1.15–2.23) were more likely than women born in Australia and New Zealand to have an antepartum stillbirth; women from Africa (aOR, 2.57; 95% CI, 1.76–3.76) were also more likely to have an intrapartum stillbirth (online Appendix, table 2).
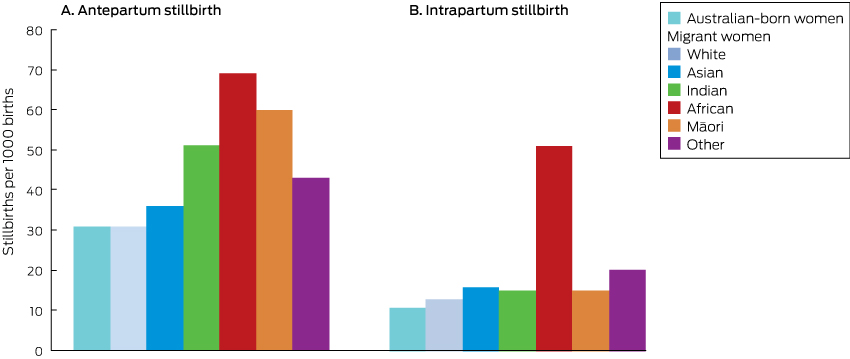
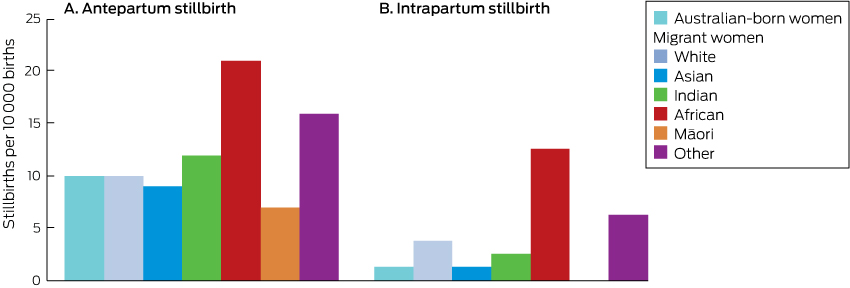
The prevalence of antepartum stillbirth among migrant women with Indian (51 v 31 per 1000 births; P = 0.013) or Māori backgrounds (60 v 31 per 1000 births; P = 0.039) during the pre-term period was significantly higher than for Australian-born women (Box 5), but was similar to that of Australian-born women during the term and post-term period (Indian women: 12 v 10 per 10 000 births; P = 0.66; Māori women: 7 v 10 per 10 000 births; P = 0.66) (Box 6). Among migrant women with African backgrounds, the prevalence rates of pre-term antepartum (69 v 31 per 1000 births; P < 0.001) and intrapartum stillbirth (48 v 10 per 1000 births; P < 0.001) were significantly higher than for Australian-born women; the term and post-term antepartum stillbirth rate was twice that of Australian-born women (21 v 10 per 10 000 births; P = 0.026), and the prevalence of intrapartum stillbirth ten times as high (10 v 1 per 10 000 births; P < 0.001). Migrants from “other” backgrounds had higher rates of intrapartum stillbirth (5 v 1 per 10 000 births; P = 0.024) than Australian-born women (Box 6). These differences remained significant in adjusted analyses (data not shown).
Discussion
In this whole population study, the prevalence of stillbirth among migrant women in WA was lower than in their countries of origin,1 but the prevalence of antepartum stillbirth was higher among migrant women with Indian, African, or “other” origins than among Australian-born women, and the prevalence of intrapartum stillbirth was higher among migrant women with African or “other” origins than among Australian-born women.
Our results are consistent with previous observations that migrant women are at higher risk of stillbirth than locally born women. But we also report, for the first time in Australia, ethnic group-specific differences in the prevalence of both ante- and intrapartum stillbirth. It was particularly notable that the prevalence of term stillbirth was much higher among migrants of African origin than Australian-born women. That the rate intrapartum stillbirth was twice as high among African women is especially worrying, as intrapartum stillbirth is regarded as preventable and indicative of inadequate quality of care.6 This finding shows the critical value of the time of death (ante- or intrapartum) for designing public health programs for averting stillbirth.
Why is the prevalence of term stillbirth in WA higher for migrants of African background? The proportion of pregnancies lasting 42 or more weeks was greater for African migrants (2.1%) than for Australian-born women (0.5%) or Asian migrants (0.2%) (Box 1). Post-term pregnancy is a recognised risk factor for stillbirth.26 The high proportion of post-term pregnancies among African migrants in WA contrasts with reports that the median gestational age at spontaneous labour among black women in London was 39 weeks,27 similar to Australian-born women in Victoria.13 Further, African Americans are less likely than white women to reach 40 weeks’ gestation (aOR, 0.81; 95% CI, 0.78–0.85).28 However, the black populations in overseas studies may not be directly comparable with African migrants to Australia.
The greater proportion of post-term pregnancies among African women in WA may reflect their lack of access to or uptake of obstetric interventions, including induction and caesarean delivery. Many African women are reluctant to undergo obstetric interventions such as caesarean delivery because they worry that multiple operations can lead to infertility or even death.29,30 It was previously reported that sub-Saharan African women in WA are significantly less likely than Australian-born women to have induced labour (OR, 0.74; 95% CI, 0.69–0.79) and more likely to have an emergency caesarean delivery (OR, 1.22; 95% CI, 1.12–1.32).31 In a qualitative study, Sudanese women in WA emphasised their suspicions about assisted birth, believing that the natural process should not be disturbed.32 These beliefs may inhibit their seeking routine antenatal care during pregnancy, resulting in lost opportunities for medical interventions that avert pre-term birth and post-term pregnancy, each of which increases the risk of stillbirth. More in-depth investigation of the patterns of health service use, pregnancy, and labour care for migrant women, particularly African migrants, is warranted. Culturally appropriate antenatal engagement and educational programs about the risk of stillbirth and the indications for and the safety of induction and related interventions may be useful preventive strategies.
Consistent with previous reports, we also found that women of Indian origin are more likely to have an antepartum stillbirth than Australian-born women.10,13 These reports included data only on antepartum stillbirth and maternal country of birth; by also including information on the time of stillbirth and ethnic background, we additionally reported that women from an Indian background and those born in South Asia are not at increased risk of intrapartum stillbirth.
We also found that the rate of pre-term (but not term) antepartum stillbirth among migrants of Māori background was significantly higher than for Australian-born women even after adjusting for several factors, including smoking. Māori women are a vulnerable population in New Zealand, having greater difficulty with communication and access to maternity services than non-Māori women, and with higher rates of adverse outcomes, including stillbirth.33 This migrant population and their health service needs in Australia require further investigation.
Limitations
We analysed routinely collected linked data, not data specifically collected for answering our research questions, and this may have led to some misclassification of exposures and outcomes; despite the cross-source ascertainment we undertook to optimise accuracy, a residual risk of misclassification remains. Another limitation arising from the analysis of large datasets is that women may have had more than one birth or stillbirth during the study period, resulting in non-independence of data, but limiting our analyses to women with only one birth record did not affect the results. Further, while our rich dataset made it possible to control for many factors, residual confounding by covariates not available in the dataset (eg, maternal weight, which may be associated with increased risk of stillbirth10,13) is possible.
The strength of our study was that type of stillbirth was available for 99.98% of stillbirths for a complete population-based cohort. Further, the population of migrants was substantial (33.9%), and we included several ethnic origin categories in our analyses. Our linked health data methodology and whole population design reduced the risk of selection, participation and recall biases.
Conclusion
In this whole population study, we explored the relationships between ethnic background and migration and the prevalence of ante- and intrapartum stillbirth. We identified ethnic groups in which the risk of one or both types is particularly high. Our findings suggest that it is imperative for reducing the number of preventable stillbirths to know the country of origin and ethnic makeup of the local population, and to target preventive strategies accordingly.
Box 1 – Pregnancy outcomes for 260 997 live and stillbirths in Western Australia, 2005–2013, by maternal ethnic origin
|
|
Australian-born women |
Migrant women |
All women |
P |
|||||||||||
|
White |
Asian |
Indian |
African |
Māori |
Other |
||||||||||
|
|
|||||||||||||||
|
All births (proportion of all births) |
172 571 (66.1%) |
48 546 (18.6%) |
18 212 (7.0%) |
5503 (2.1%) |
4155 (1.6%) |
2941 (1.1%) |
9038 (3.5%) |
260 997 |
|
||||||
|
Pregnancy outcomes |
|
|
|
|
|
|
|
|
|
||||||
|
Live birth |
171 759 (99.5%) |
48 315 (99.5%) |
18 117 (99.5%) |
5464 (99.3%) |
4104 (98.8%) |
2923 (99.4%) |
8972 (99.3%) |
259 684 (99.5%) |
0.001 |
||||||
|
Stillbirth (total) |
812 (0.5%) |
231 (0.5%) |
95 (0.5%) |
39 (0.7%) |
51 (1.2%) |
18 (0.6%) |
66 (0.7%) |
1313 (0.5%) |
0.001 |
||||||
|
Antepartum |
605 (0.4%) |
162 (0.3%) |
69 (0.4%) |
31 (0.6%) |
31 (0.8%) |
15 (0.5%) |
47 (0.5%) |
960 (0.4%) |
0.002 |
||||||
|
Intrapartum |
185 (0.1%) |
57 (0.1%) |
24 (0.1%) |
< 10 (< 0.1%) |
20 (0.5%) |
< 10 (< 0.1%) |
19 (0.2%) |
317 (0.1%) |
0.001 |
||||||
|
Undefined |
22 (< 0.1%) |
12 (< 0.1%) |
< 10 (< 0.1%) |
0 |
0 |
0 |
0 |
36 (< 0.1%) |
0.06 |
||||||
|
Sex of baby |
|
|
|
|
|
|
|
|
0.98 |
||||||
|
Boy |
88 307 (51.2%) |
24 720 (50.9%) |
9466 (52.0%) |
2813 (51.1%) |
2131 (51.3%) |
1490 (50.7%) |
4608 (51.0%) |
133 549 (51.2%) |
|
||||||
|
Girl |
84 252 (48.8%) |
23 821 (49.1%) |
8745 (48.0%) |
2690 (48.9%) |
2023 (48.7%) |
1451 (49.3%) |
4429 (49.0%) |
127 428 (48.8%) |
|
||||||
|
Undetermined |
12 (< 0.1%) |
< 10 (< 0.1%) |
< 10 (< 0.1%) |
0 |
< 10 (< 0.1%) |
0 |
< 10 (< 0.1%) |
20 (< 0.1%) |
|
||||||
|
Plurality |
|
|
|
|
|
|
|
|
0.025 |
||||||
|
Singleton |
167 481 (97.1%) |
47 075 (97.0%) |
17 822 (97.9%) |
5389 (97.9%) |
4031 (97.0%) |
2883 (98.0%) |
8725 (96.5%) |
253 435 (97.1%) |
|
||||||
|
Multiple |
5090 (2.9%) |
1471 (3.0%) |
390 (2.1%) |
114 (2.1%) |
124 (3.0%) |
58 (2.0%) |
313 (3.5%) |
7562 (2.9%) |
|
||||||
|
Gestational age (weeks) |
|
|
|
|
|
< 0.001 |
|||||||||
|
20–27 |
1025 (0.6%) |
261 (0.5%) |
121 (0.7%) |
45 (0.8%) |
55 (1.3%) |
25 (0.9%) |
94 (1.0%) |
1626 (0.6%) |
|
||||||
|
28–31 |
1288 (0.8%) |
328 (0.7%) |
123 (0.7%) |
47 (0.9%) |
41 (1.0%) |
19 (0.7%) |
72 (0.8%) |
1919 (0.7%) |
|
||||||
|
32–36 |
11 893 (6.9%) |
3172 (6.5%) |
1260 (6.9%) |
399 (7.3%) |
235 (5.7%) |
173 (5.9%) |
622 (6.9%) |
17 754 (6.8%) |
|
||||||
|
37–41 |
157 498 (91.3%) |
44 520 (91.7%) |
16 665 (91.5%) |
4997 (90.8%) |
3737 (89.9%) |
2705 (92.0%) |
8187 (90.6%) |
238 336 (91.3%) |
|
||||||
|
≥ 42 |
867 (0.5%) |
265 (0.6%) |
43 (0.2%) |
15 (0.3%) |
87 (2.1%) |
19 (0.7%) |
63 (0.8%) |
1362 (0.5%) |
|
||||||
|
Complications of pregnancy |
|
|
|
|
|
< 0.001 |
|||||||||
|
Gestational diabetes |
7710 (4.5%) |
2732 (5.6%) |
2306 (12.7%) |
868 (15.8%) |
312 (7.5%) |
117 (4.0%) |
862 (9.5%) |
14 907 (5.7%) |
|
||||||
|
Pre-eclampsia |
5114 (3.0%) |
1194 (2.5%) |
325 (1.8%) |
124 (2.3%) |
127 (3.1%) |
77 (2.6%) |
216 (2.4%) |
7177 (2.8%) |
|
||||||
|
Any complication |
57 596 (33.4%) |
15 330 (31.6%) |
6489 (35.6%) |
2162 (39.3%) |
1339 (32.2%) |
925 (31.5%) |
3214 (35.6%) |
87 059 (33.4%) |
|
||||||
|
|
|||||||||||||||
|
|
|||||||||||||||
Box 2 – Characteristics of mothers for 260 997 live and stillbirths in Western Australia, 2005–2013, by maternal ethnic origin
|
|
Australian-born women |
Migrant women |
All women |
P |
|||||||||||
|
White |
Asian |
Indian |
African |
Māori |
Other |
||||||||||
|
|
|||||||||||||||
|
Total number |
172 571 |
48 546 |
18 212 |
5503 |
4155 |
2941 |
9038 |
260 997 |
|
||||||
|
Marital status |
|
|
|
|
|
|
|
|
< 0.001 |
||||||
|
Never married |
18 016 (10.4%) |
3026 (6.2%) |
701 (3.9%) |
99 (1.8%) |
543 (13.1%) |
570 (19.4%) |
611 (6.8%) |
23 568 (9.0%) |
|
||||||
|
Divorced/separated |
1554 (0.9%) |
360 (0.7%) |
160 (0.9%) |
17 (0.3%) |
109 (2.6%) |
33 (1.1%) |
132 (1.5%) |
2366 (0.9%) |
|
||||||
|
Married/de facto |
151 831 (88.0%) |
44 693 (92.1%) |
17 107 (93.9%) |
5327 (96.8%) |
3449 (83.0%) |
2268 (77.1%) |
8214 (90.9%) |
232 917 (89.2%) |
|
||||||
|
Other |
1170 (0.7%) |
467 (1.0%) |
244 (1.3%) |
60 (1.1%) |
54 (1.3%) |
70 (2.4%) |
81 (0.9%) |
2146 (0.8%) |
|
||||||
|
Parity |
|
|
|
|
|
|
|
|
< 0.001 |
||||||
|
Nulliparous |
73 456 (42.6%) |
21 205 (43.7%) |
8759 (48.1%) |
3204 (58.2%) |
1217 (29.3%) |
955 (32.5%) |
3532 (39.1%) |
112 340 (43.0%) |
|
||||||
|
Primiparous |
60 403 (35.1%) |
17 243 (35.5%) |
6485 (35.6%) |
1817 (33.0%) |
1113 (26.8%) |
792 (26.9%) |
2695 (29.8%) |
90 561 (34.7%) |
|
||||||
|
Multiparous |
38 712 (22.5%) |
10 098 (20.8%) |
2968 (16.3%) |
482 (8.8%) |
1825 (43.9%) |
1194 (40.6%) |
2811 (31.1%) |
58 096 (22.3%) |
|
||||||
|
Maternal age (years) |
|
|
|
|
|
|
|
|
< 0.001 |
||||||
|
Mean (SD) |
29.5 (5.6) |
31.5 (5.3) |
31.2 (4.9) |
29.5 (4.4) |
28.8 (5.7) |
26.8 (6.0) |
29.9 (5.6) |
30.0 (5.6) |
|
||||||
|
< 20 |
7474 (4.3%) |
724 (1.5%) |
131 (0.7%) |
17 (0.3%) |
197 (4.7%) |
300 (10.2%) |
200 (2.2%) |
9045 (3.5%) |
|
||||||
|
20–24 |
27 516 (16.0%) |
4364 (9.0%) |
1401 (7.7%) |
638 (11.6%) |
826 (19.9%) |
889 (30.2%) |
1477 (16.3%) |
37 115 (14.2%) |
|
||||||
|
25–29 |
49 076 (28.4%) |
11 423 (23.5%) |
5208 (28.6%) |
2288 (41.6%) |
1254 (30.2%) |
786 (26.7%) |
2631 (29.1%) |
72 673 (27.8%) |
|
||||||
|
30–34 |
54 744 (31.7%) |
17 464 (36.0%) |
6937 (38.1%) |
1869 (34.0%) |
1169 (28.1%) |
599 (20.4%) |
2714 (30.0%) |
85 510 (32.8%) |
|
||||||
|
35–39 |
28 412 (16.5%) |
11716 (24.1%) |
3713 (20.4%) |
581 (10.6%) |
586 (14.1%) |
290 (9.9%) |
1612 (17.8%) |
46 914 (18.0%) |
|
||||||
|
40–44 |
5159 (3.0%) |
2703 (5.6%) |
785 (4.3%) |
103 (1.9%) |
112 (2.7%) |
77 (2.6%) |
389 (4.3%) |
9328 (3.6%) |
|
||||||
|
>44 |
190 (0.1%) |
152 (0.3%) |
37 (0.2%) |
< 10 (0.1%) |
11 (0.3%) |
0 |
15 (0.2%) |
412 (0.2%) |
|
||||||
|
Medical conditions |
|
|
|
|
|
|
|
|
< 0.001 |
||||||
|
Diabetes |
1040 (0.6%) |
285 (0.6%) |
97 (0.5%) |
53 (1.0%) |
30 (0.7%) |
15 (0.5%) |
63 (0.7%) |
1583 (0.6%) |
|
||||||
|
Asthma |
21 728 (12.6%) |
4208 (8.7%) |
642 (3.5%) |
154 (2.8%) |
85 (2.1%) |
356 (12.1%) |
440 (4.9%) |
27 615 (10.6%) |
|
||||||
|
Hypertension |
2134 (1.2%) |
579 (1.2%) |
109 (1.6%) |
28 (0.5%) |
33 (0.8%) |
31 (1.1%) |
70 (0.8%) |
2984 (1.1%) |
|
||||||
|
Smoked while pregnant |
|
|
|
|
|
< 0.001 |
|||||||||
|
Yes |
24 097 (14.0%) |
4161 (8.6%) |
317 (1.7%) |
40 (0.7%) |
78 (1.9%) |
1152 (39.2%) |
494 (5.5%) |
30 342 (11.6%) |
|
||||||
|
No |
148 474 (86.0%) |
44 385 (91.4%) |
17 895 (98.3%) |
5463 (99.3%) |
4077 (98.1%) |
1789 (60.8%) |
8544 (94.5%) |
230 655 (88.4%) |
|
||||||
|
Index of Relative Socio-economic Disadvantage (quintiles) |
|
|
|
|
|
< 0.001 |
|||||||||
|
1 (most disadvantaged) |
40 521 (23.5%) |
6547 (13.5%) |
2181 (12.0%) |
663 (12.1%) |
513 (12.4%) |
800 (27.2%) |
1276 (14.1%) |
52 504 (20.1%) |
|
||||||
|
2 |
34 062 (19.7%) |
8343 (17.2%) |
3526 (19.4%) |
1137 (20.7%) |
781 (18.8%) |
895 (30.4%) |
1882 (20.8%) |
50 631 (19.4%) |
|
||||||
|
3 |
38 893 (22.5%) |
14 192 (29.2%) |
5380 (29.5%) |
1863 (33.9%) |
1998 (48.10%) |
645 (21.9%) |
3098 (34.3%) |
66 081 (25.3%) |
|
||||||
|
4 |
22 519 (13.1%) |
5666 (11.7%) |
2939 (16.1%) |
915 (16.6%) |
441 (10.6%) |
357 (12.1%) |
1192 (13.2%) |
34 031 (13.0%) |
|
||||||
|
5 (least disadvantaged) |
30 662 (17.8%) |
12 337 (25.4%) |
3615 (19.9%) |
730 (13.3%) |
295 (7.1%) |
166 (5.6%) |
1321 (14.6%) |
49 132 (18.8%) |
|
||||||
|
|
|||||||||||||||
|
SD = standard deviation. |
|||||||||||||||
Box 3 – Prevalence of stillbirths in Western Australia, 2005–2013, by ethnic origin of mother and type of stillbirth
|
Ethnic origin of mother |
Rate (per 1000 births) |
||||||||||||||
|
All stillbirths |
Antepartum stillbirth |
Intrapartum stillbirth |
|||||||||||||
|
|
|||||||||||||||
|
Australian-born |
4.7 |
3.5 |
1.1 |
||||||||||||
|
Overseas-born |
5.7 |
4.0 |
1.5 |
||||||||||||
|
White (from United Kingdom, 43%; New Zealand, 15%) |
4.8 |
3.3 |
1.2 |
||||||||||||
|
Asian (from China, 14%; Vietnam, 14%; Malaysia, 13%; Indonesia, 11%; Philippines, 11%) |
5.2 |
3.8 |
1.3 |
||||||||||||
|
Indian (from India, 70%) |
7.1 |
5.6 |
1.5 |
||||||||||||
|
African (from Sudan, 28%; Somalia, 13%) |
12.3 |
7.5 |
4.8 |
||||||||||||
|
Māori (from New Zealand, 97%) |
6.1 |
5.1 |
1.0 |
||||||||||||
|
Other* (from Iraq, 9%; Afghanistan, 6%; Sudan, 3.5%; Somalia 2%; Saudi Arabia, 2%) |
7.3 |
5.2 |
2.1 |
||||||||||||
|
All women |
5.0 |
3.7 |
1.2 |
||||||||||||
|
|
|||||||||||||||
|
The rates of ante- and intrapartum stillbirth may not sum to that of all stillbirths because of the small proportion of undefined stillbirths. * 71% of women in this category were born in Asia or Africa but did not declare their ethnic origin as Asian, Indian or African. |
|||||||||||||||
Box 4 – Stillbirth in Western Australia, 2005–2013: comparison of migrant women, by ethnic origin, with Australian-born women
|
Ethnic origin |
All stillbirth |
Antepartum stillbirth |
Intrapartum stillbirth |
||||||||||||
|
OR (95% CI) |
aOR* (95% CI) |
OR (95% CI) |
aOR* (95% CI) |
OR (95% CI) |
aOR* (95% CI) |
||||||||||
|
|
|||||||||||||||
|
Australian-born |
1 |
1 |
1 |
1 |
1 |
1 |
|||||||||
|
Overseas-born |
1.20 (1.08–1.35) |
1.26 (1.09–1.37) |
1.15 (1.01–1.31) |
1.20 (1.02–1.33) |
1.38 (1.11–1.73) |
1.38 (1.09–1.72) |
|||||||||
|
White |
1.01 (0.87–1.17) |
1.07 (0.86–1.16) |
0.95 (0.80–1.13) |
1.01 (0.79–1.13) |
1.10 (0.81–1.47) |
1.11 (0.77–1.42) |
|||||||||
|
Asian |
1.11 (0.90–1.37) |
1.17 (0.95–1.47) |
1.08 (0.84–1.39) |
1.15 (0.89–1.48) |
1.23 (0.80–1.88) |
1.20 (0.81–1.91) |
|||||||||
|
Indian |
1.51 (1.09–2.08) |
1.58 (1.13–2.19) |
1.61 (1.12–2.31) |
1.71 (1.17–2.47) |
1.36 (0.67–2.75) |
1.25 (0.69–2.90) |
|||||||||
|
African |
2.63 (1.98–3.49) |
2.74 (2.04–3.69) |
2.14 (1.49–3.07) |
2.12 (1.46–3.08) |
4.51 (2.84–7.16) |
5.08 (3.14–8.22) |
|||||||||
|
Māori |
1.30 (0.82–2.08) |
1.27 (0.83–2.14) |
1.46 (0.87–2.44) |
1.39 (0.86–2.41) |
0.95 (0.30–2.98) |
1.00 (0.34–3.42) |
|||||||||
|
Other |
1.56 (1.21–2.00) |
1.51 (1.17–1.96) |
1.49 (1.10–2.00) |
1.43 (1.06–1.93) |
1.96 (1.22–3.15) |
1.86 (1.15–3.00) |
|||||||||
|
|
|||||||||||||||
|
aOR = adjusted odds ratio; CI = confidence interval; OR = odds ratio. * Adjusted for previous stillbirth, year of birth, maternal age group, sex of baby, marital status, pregnancy complication, medical conditions, smoking during pregnancy, parity, plurality and Index of Relative Socio-economic Disadvantage. |
|||||||||||||||
Received 6 April 2018, accepted 20 July 2018
- Maryam Mozooni1
- David B Preen1
- Craig E Pennell2
- 1 University of Western Australia, Perth, WA
- 2 University of Newcastle, Newcastle, NSW
We thank the staff at the Western Australian Data Linkage Branch, as well as the data collections staff and data custodians of the Midwives Notification System, the Hospital Morbidity Data Collection, Birth, Death, and Marriage Registrations, and the Western Australia Register of Developmental Anomalies. The investigation was funded by a Postgraduate Award from the University of Western Australia, a Professor Gordon King Top-up Scholarship from the Women and Infants Research Foundation, and a grant (0060/2017) from Red Nose (formerly: SIDS and Kids). We gratefully acknowledge the support of Red Nose as we work together to prevent stillbirth.
No relevant disclosures.
- 1. Blencowe H, Cousens S, Jassir FB, et al. National, regional, and worldwide estimates of stillbirth rates in 2015, with trends from 2000: a systematic analysis. Lancet Glob Health 2016; 4: e98-e108.
- 2. Ogwulu CB, Jackson LJ, Heazell AEP, Roberts TE. Exploring the intangible economic costs of stillbirth. BMC Pregnancy Childbirth 2015; 15: 188.
- 3. Heazell AE, Siassakos D, Blencowe H, et al. Stillbirths: economic and psychosocial consequences. Lancet 2016; 387: 604-616.
- 4. de Bernis L, Kinney MV, Stones W, et al. Stillbirths: ending preventable deaths by 2030. Lancet 2016; 387: 703-716.
- 5. Cousens S, Blencowe H, Stanton C, et al. National, regional, and worldwide estimates of stillbirth rates in 2009 with trends since 1995: a systematic analysis. Lancet 2011; 377: 1319-1330.
- 6. Lawn JE, Blencowe H, Waiswa P, et al. Stillbirths: rates, risk factors, and acceleration towards 2030. Lancet 2016; 387: 587-603.
- 7. Flenady V, Wojcieszek AM, Middleton P, et al. Stillbirths: recall to action in high-income countries. Lancet 2016; 387: 691-702.
- 8. United Nations, Department of Economic and Social Affairs, Population Division. International migration report 2017: highlights (ST/ESA/SER.A/404). New York: UN, 2017. http://www.un.org/en/development/desa/population/migration/publications/migrationreport/docs/MigrationReport2017_Highlights.pdf (viewed Dec 2017).
- 9. Gardosi J, Madurasinghe V, Williams M, Malik A, Francis A. Maternal and fetal risk factors for stillbirth: population based study. BMJ 2013; 346: f108.
- 10. Drysdale H, Ranasinha S, Kendall A, et al. Ethnicity and the risk of late-pregnancy stillbirth. Med J Aust 2012; 197: 278-281. <MJA full text>
- 11. Small R, Gagnon A, Gissler M, et al. Somali women and their pregnancy outcomes postmigration: data from six receiving countries. BJOG 2008; 115: 1630-1640.
- 12. Khalil A, Rezende J, Akolekar R, et al. Maternal racial origin and adverse pregnancy outcome: a cohort study. Ultrasound Obstet Gynecol 2013; 41: 278-285.
- 13. Davies-Tuck ML, Davey MA, Wallace EM. Maternal region of birth and stillbirth in Victoria, Australia 2000–2011: a retrospective cohort study of Victorian perinatal data. PLoS One 2017; 12: e0178727.
- 14. Australian Bureau of Statistics. 6250.0. Characteristics of recent migrants, Australia, 2016. June 2017. http://www.abs.gov.au/ausstats/abs@.nsf/mf/6250.0 (viewed Feb 2018).
- 15. Australian Institute of Health and Welfare. Australia’s mothers and babies 2015 — in brief (AIHW Cat. NoPER91; Perinatal Statistics Series No. 33). Canberra: AIHW, 2017.
- 16. Australian Bureau of Statistics. 3218.0. Regional population growth, Australia, 2016. July 2017. http://www.abs.gov.au/AUSSTATS/abs@.nsf/Lookup/3218.0Main+Features12016?OpenDocument (viewed Feb 2018).
- 17. Australian Bureau of Statistics. 2016 Census QuickStats: Western Australia. Updated July 2018. http://www.censusdata.abs.gov.au/census_services/getproduct/census/2016/quickstat/5?opendocument (viewed Feb 2018).
- 18. Balchin I, Whittaker JC, Patel RR, et al. Racial variation in the association between gestational age and perinatal mortality: prospective study. BMJ 2007; 334: 833.
- 19. Holman CD, Bass AJ, Rouse IL, Hobbs MS. Population-based linkage of health records in Western Australia: development of a health services research linked database. Aust N Z J Public Health 1999; 23: 453-459.
- 20. Australian Bureau of Statistics. 2039.0. An introduction to Socio-Economic Indexes for Areas (SEIFA), 2006. Mar 2008. http://www.abs.gov.au/ausstats/abs@.nsf/mf/2039.0 (viewed Feb 2018).
- 21. Holman CD, Bass AJ, Rosman DL, et al. A decade of data linkage in Western Australia: strategic design, applications and benefits of the WA data linkage system. Aust Health Rev 2008; 32: 766-777.
- 22. Kelman C, Bass A, Holman C. Research use of linked health data: a best practice protocol. Aust N Z J Public Health 2002; 26: 251-255.
- 23. Downey F. A validation study of the Western Australian Midwives’ Notification System. 2005 birth data (Statistical Series No. 78). Perth: Department of Health, Western Australia, 2007. http://ww2.health.wa.gov.au/∼/media/Files/Corporate/general%20documents/Data%20collection/PDF/Midwives_Validation_Study_2007.ashx (viewed June 2018).
- 24. Ballestas T, on behalf of the Perinatal and Infant Mortality Committee of Western Australia. The 14th report of the Perinatal and Infant Mortality Committee of Western Australia for deaths in the triennium 2008–2010. Perth: Department of Health, Western Australia, 2014. https://ww2.health.wa.gov.au/∼/media/Files/Corporate/Reports%20and%20publications/Perinatal%20infant%20and%20maternal/12781_the_14th_perinatal_report.pdf (viewed June 2018).
- 25. Gissler M, Alexander S, MacFarlane A, et al. Stillbirths and infant deaths among migrants in industrialized countries. Acta Obstet Gynecol Scand 2009; 88: 134-148.
- 26. Gulmezoglu AM, Crowther CA, Middleton P, Heatley E. Induction of labour for improving birth outcomes for women at or beyond term. Cochrane Database Syst Rev 2012; (6): CD004945.
- 27. Patel R, Steer P, Doyle P, et al. Does gestation vary by ethnic group? A London-based study of over 122 000 pregnancies with spontaneous onset of labour. Int J Epidemiol 2004; 33: 107-113.
- 28. Caughey AB, Stotland NE, Washington AE, Escobar GJ. Who is at risk for prolonged and postterm pregnancy? Am J Obstet Gynecol 2009; 200: 683.e1-683.e5.
- 29. Brown E, Carroll J, Fogarty C, Holt C. “They get a C-section … they gonna die”: Somali women’s fears of obstetrical interventions in the United States. J Transcult Nurs 2010; 21: 220-227.
- 30. Deyo NS. Cultural traditions and the reproductive health of Somali refugees and immigrants [thesis]. University of San Francisco, 2012. https://repository.usfca.edu/thes/29 (viewed Dec 2017).
- 31. von Katterfeld B, Li J, McNamara B, Langridge AT. Obstetric profiles of foreign-born women in Western Australia using data linkage, 1998–2006. Aust N Z J Obstet Gynaecol 2011; 51: 225-232.
- 32. von Katterfeld B. Motherhood after migration: perinatal health and wellbeing among culturally and linguistically diverse foreign-born women in Western Australia [thesis]. University of Western Australia, 2011. http://research-repository.uwa.edu.au/files/3230539/Von_Katterfeld_Brilliana_2011.pdf (viewed July 2018).
- 33. Ratima M, Crengle S. Antenatal, labour, and delivery care for Māori: experiences, location within a lifecourse approach, and knowledge gaps. Pimatisiwin 2013; 10: 353-366. https://pdfs.semanticscholar.org/a08c/e1b766c7dc16ea3461c3db5f3c61418530b3.pdf (viewed Aug 2018).
Abstract
Objective: To investigate prevalence rates and the risk of ante- and intrapartum stillbirth in Western Australia with respect to maternal country of birth and ethnic origin.
Design, setting and participants: Whole population retrospective cohort analysis of de-identified, linked routinely collected birth, perinatal and mortality data for all births to non-Indigenous women in WA during 2005–2013.
Main outcome measures: Crude and adjusted odds ratios (aORs) with 95% confidence intervals were estimated by logistic regression and adjusted for confounding factors, for all stillbirths, antepartum stillbirths and intrapartum stillbirths, stratified by migrant status and ethnic background (white, Asian, Indian, African, Māori, other).
Results: Women born overseas were more likely to have a stillbirth than Australian-born women (aOR, 1.26; 95% CI, 1.09–1.37). There was no significant difference for any type of stillbirth between Australian-born women of white and non-white backgrounds, but non-white migrant women were more likely than white migrants to have a stillbirth (OR, 1.42; 95% CI, 1.19–1.70). Compared with Australian-born women, migrants of Indian (aOR, 1.71; 95% CI, 1.17–2.47), African (aOR, 2.12; 95% CI, 1.46–3.08), and “other” ethnic origins (aOR, 1.43; 95% CI, 1.06–1.93) were more likely to have antepartum stillbirths; women of African (aOR, 5.08; 95% CI, 3.14–8.22) and “other” (aOR, 1.86; 95% CI, 1.15–3.00) background were more likely to have an intrapartum stillbirth.
Conclusions: Immigrants of African or Indian background appear to be at greater risk of ante- and intrapartum stillbirth in WA. Specific strategies are needed reduce the prevalence of stillbirth in these communities.