


The known There is a paucity of data on outcomes for patients with different lymphoma subtypes in Australia. It is unknown whether relative survival has improved in recent decades with changes in treatment.
The new Five-year relative survival for patients with B-cell non-Hodgkin lymphoma improved significantly after the introduction of rituximab as first-line therapy (2003–2006). There has been no change in relative survival for patients with Hodgkin lymphoma.
The implications Rituximab has significantly improved relative survival for patients with B-cell non-Hodgkin lymphomas in Australia and is a vital part of current management.
Lymphoma encompasses a diverse group of cancers derived from the transformation and proliferation of lymphocytes. Lymphomas are broadly divided into Hodgkin and non-Hodgkin lymphomas, then further into B- or T-cell origin lymphomas, and finally into aggressive or indolent according to morphology and clinical assessment. In 2017, lymphoma was the sixth most commonly diagnosed cancer in Australia (6232 new cases) and the 12th most common cause of death from cancer (1481 deaths). The prevalence of lymphoma is increasing as more people are diagnosed and survival improves; the age-standardised incidence increased from 15 cases per 100 000 persons in 1982 to 22 cases per 100 000 persons in 2013.1
There is a paucity of data on outcomes for patients with different lymphoma subtypes in Australia. The past decades have seen significant improvements in the diagnosis and classification of lymphoma and the introduction of positron-emission tomography scans. However, chemotherapy protocols (such as cyclophosphamide/hydroxydaunorubicin/oncovin/prednisolone [CHOP] and adriamycin/bleomycin/vinblastine/dacarbazine [ABVD]), stem cell transplantation and radiation have not undergone similarly radical changes. Analyses of randomised trials2-4 and overseas population-based registries have indicated that rituximab, an anti-CD20 monoclonal antibody, improves survival of patients with B-cell non-Hodgkin lymphoma;5 an Australian analysis found some benefit for the addition of rituximab to standard chemotherapy.6
A number of Australian and overseas studies have identified differences in survival for patients from rural and urban regions with cancer.7-9 While inferior survival rates for non-urban residents with solid tumours are often reported, corresponding information on rural and urban patients with lymphoma is limited. Similarly, lower socio-economic status is presumed to predict inferior survival, but whether place of residence or socio-economic status influence outcomes for patients in Australia with lymphoma is unknown.
The primary objective of our study was to evaluate relative survival of patients with different lymphoma subtypes in Queensland and to determine whether outcomes have improved with recent advances in treatment. The secondary objectives were to evaluate relative survival according to place of residence (urban v rural) and socio-economic status.
Methods
Data source and patients
Data analysed in our study were obtained from the Oncology Analysis System (OASys), the population-based online reporting tool for cancer incidence and outcomes in Queensland. OASys is operated by Cancer Alliance Queensland, which includes the Queensland Cancer Registry (QCR) and the Queensland Cancer Control Analysis Team (QCCAT). QCR records of cancer diagnoses for patients living in Queensland since 1982 and further linked data are consolidated by QCCAT into a single database, the Queensland Oncology Repository (QOR), the basis of OASys.
Patients were included in our analysis if they were more than 15 years old and had been diagnosed with lymphoma in Queensland during the calendar years 1993–2012. Demographic information included age at diagnosis, sex, and region (remoteness) and socio-economic status of residence. Remoteness was categorised according to Australian Standard Geographical Classification (ASGC) at diagnosis,10 and grouped into urban (Brisbane, Gold Coast, Townsville) and rural categories (inner/outer regional, remote, very remote regions). Socio-economic status was classified according to the Socio-Economic Indexes For Areas (SEIFA) Index of Relative Socio-economic Disadvantage (IRSD; quintile 1, most disadvantaged; quintile 5, least disadvantaged), which is based on the characteristics of the area of residence (primarily census data on income, education, employment, occupation, and housing).11 Patients diagnosed prior to 1993 were excluded because lymphoma subtype diagnoses were less precise and therapy less uniform before 1993. Data on disease stage, treatment received, response to therapy, and relapse were not available for individual patients.
“Rituximab era” was defined according to when the drug was first listed by the Pharmaceutical Benefits Scheme for first-line therapy. For diffuse large B-cell lymphoma (DLBCL), this was from July 2003 for patients aged 60 years or more and from April 2005 for patients under 60; for patients with untreated advanced stage follicular lymphoma, it was December 2006.
Lymphoma diagnoses
Lymphomas cannot be analysed as a single group in epidemiological studies because of the marked heterogeneity in disease biology, treatment, response to treatment, and curability. We therefore included common subtypes for which the histological diagnosis is likely to have been consistent during the study period: DLBCL, follicular lymphoma, highly aggressive lymphomas (eg, Burkitt lymphoma, plasmablastic lymphoma), Hodgkin lymphoma, and peripheral T-cell lymphomas (PTCLs).
Statistical analysis
The 20-year study period was divided into 5-year eras for assessing the impact of treatment changes and rituximab availability. In the primary analysis, we estimated the relative survival of patients with each lymphoma subtype, employing a cohort approach and the Ederer II method.12 Relative survival is defined as the ratio of the number of observed deaths in a cancer cohort to the observed number of deaths in a cohort of individuals without cancer. We compared the mortality of lymphoma patients with that of the general population using age-, sex-, and calendar period-generated (expected) mortality rates from Queensland life tables in OASys compiled from Australian Bureau of Statistics population and death data.13
The influence on relative survival of sex, place of residence (urban v rural), socio-economic status, age group (10-year bands), and year of diagnosis (5-year bands) were assessed in univariate and multivariate analyses with a full maximum likelihood approach;14,15 variables that were non-significant in the univariate analysis were also included in the multivariate analysis.
Overall survival — the proportion of patients still living at a given time point — was determined by the Kaplan–Meier method.
Seven patients for whom data for place of residence or socio-economic status were missing were excluded from the relevant analyses. Statistical analyses were performed in Stata 13.1 (StataCorp).
Ethics approval
The study was approved by the Queensland Metro South Health Human Research Ethics Committee (reference, HREC/14/QPAH/194).
Results
Patient characteristics
In total, 9509 patients (5321 men, 4188 women) were diagnosed with lymphoma between 1993 and 2012 in Queensland: 3998 with DLBCL, 3003 with follicular lymphoma, 292 with aggressive lymphoma, 1563 with Hodgkin lymphoma, and 653 with PTCLs (Box 1). The median age of patients with DLBCL was 67 years (interquartile range [IQR], 55–76 years), follicular lymphoma 62 years (IQR, 51–71 years), aggressive lymphoma 27 years (IQR, 11–57 years), Hodgkin lymphoma 35 years (IQR, 23–58 years) and PTCL 62 years (47–74 years).
Diffuse large B-cell lymphoma
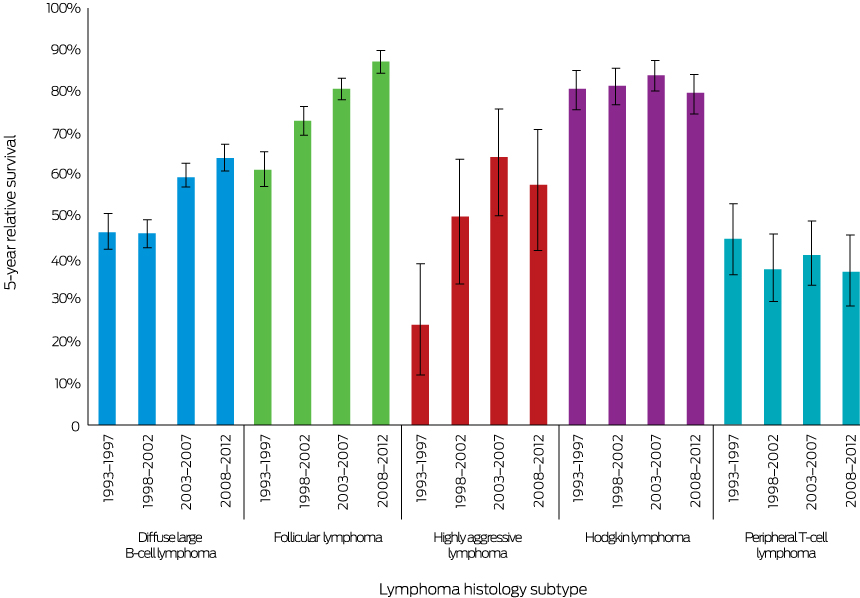
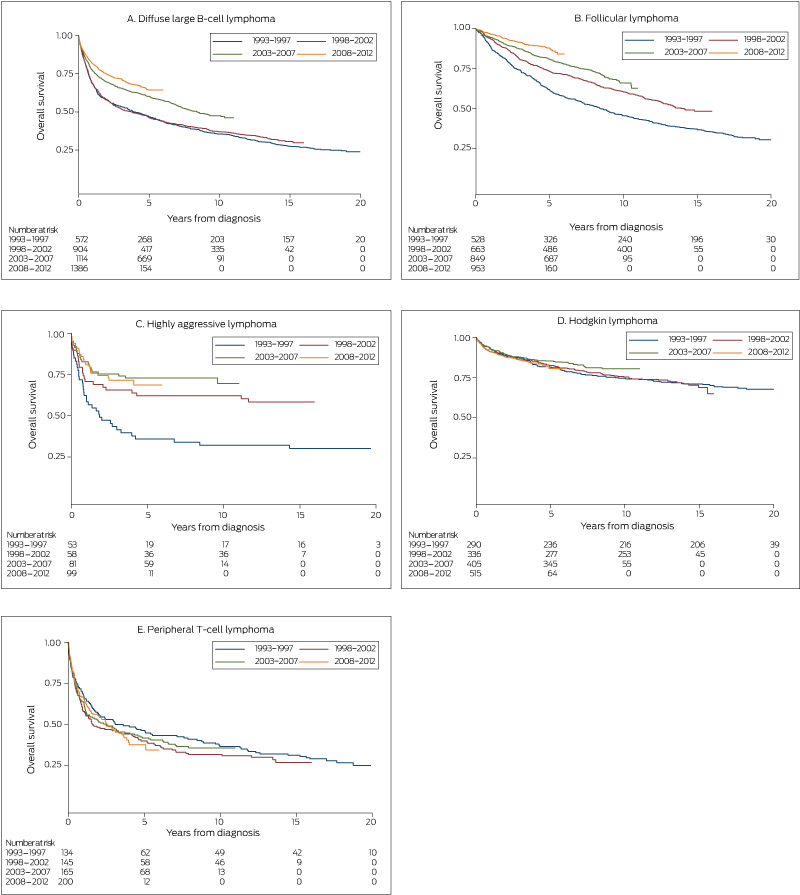
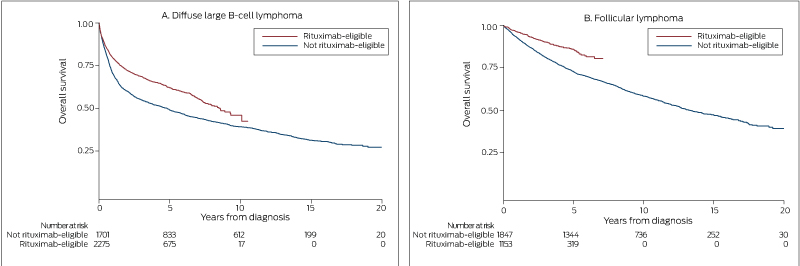
Five-year relative survival improved significantly, from 47% (95% confidence interval [CI], 42–51%) in 1993–1997 to 64% (95% CI, 61–67%) in 2008–2012 (P < 0.001) (Box 2). Similarly, 5-year overall survival increased from 47% (1993–1997 and 1998–2002) to 60% (2003–2007) and 64% (2008–2012) (each P < 0.001) (Box 3, A). Five-year overall survival increased after rituximab was introduced, from 49% to 62% (P < 0.001) (Box 4, A).
In the univariate analysis, relative survival was not significantly influenced by place of residence (P = 0.18), but was affected by socio-economic status (v quintile 5 [least disadvantaged]: quintiles 2–4, hazard ratio [HR], 1.19; 95% CI, 1.03–1.37; P = 0.019; quintile 1, HR, 1.24; 95% CI, 1.04–1.48; P = 0.017) (table in online Appendix). In the multivariate analysis, relative survival was lower for rural residents (HR, 1.14; 95% CI, 1.01–1.28; P = 0.034) but was not significantly influenced by socio-economic status. Relative survival was significantly lower for men (HR, 1.24; 95% CI, 1.12–1.37; P < 0.001) and higher for those treated during the rituximab era (HR, 0.56; 95% CI, 0.51–0.62; P < 0.001). Relative survival declined with increasing age (Box 5).
Follicular lymphoma
Five-year relative survival increased significantly, from 62% (95% CI, 57–66%) during 1993–1997 to 88% (95% CI, 85–90%) during 2008–2012 (P < 0.001) (Box 2). Similarly, 5-year overall survival increased from 62% during 1993–1997 to 73% during 1998-2002, 81% during 2003–2007, and 88% during 2008–2012 (each P < 0.001) (Box 3, B). Five-year overall survival increased after rituximab was introduced from 73% to 86% (P < 0.001) (Box 4, B).
In the univariate analysis, place of residence (rural v urban: HR, 1.28; 95% CI, 1.09–1.51; P = 0.003) and socio-economic status (quintile 1 [most disadvantaged] v quintile 5 [least disadvantaged]: HR, 1.58; 95% CI 1.20–2.07; P = 0.001) significantly influenced relative survival (table in online Appendix). The effects of neither factor were statistically significant in the multivariate analysis, but relative survival was significantly lower for men (HR, 1.25; 95% CI, 1.06–1.46; P = 0.006) and decreased with age. Relative survival increased after rituximab was introduced (HR, 0.47; 95% CI, 0.39–0.58; P < 0.001) (Box 5).
Highly aggressive lymphoma
Five-year relative survival increased significantly, from 24% (95% CI, 12–39%) during 1993–1997 to 58% (95% CI, 42–71%) during 2008–2012 (P = 0.001) (Box 2). Similarly, 5-year overall survival increased from 37% during 1993–1997 to 69% during 2008–2012 (P < 0.001) (Box 3, C).
In the univariate analysis, place of residence and socio-economic status did not significantly influence relative survival (table in online Appendix). In the multivariate analysis, relative survival was greatest for patients under 25 years of age (v 55–64 years of age: HR, 0.39; 95% CI, 0.18–0.85, P = 0.018) (Box 5). Relative survival was significantly lower for patients aged 75–84 years (v 55–64 years of age: HR, 2.64; 95% CI; 1.24–5.62), but the number of patients was very small. Compared with 1993–1997, relative survival was significantly higher during 2003–2007 (HR, 0.29; 95% CI; 0.15–0.54; P < 0.001).
Hodgkin lymphoma
Five-year relative survival was similar during 1993–1997 (81%; 95% CI, 76–85%) and 2008–2012 (80%; 95% CI, 75–84%; P = 0.22) (Box 2), as was 5-year overall survival (1993–1997, 82%; 2008–2012, 80%; P = 0.70) (Box 3, D).
In the univariate analysis, relative survival was not significantly influenced by place of residence (HR, 1.30; 95% CI, 1.00–1.70; P = 0.05), but was influenced by socio-economic status (quintile 1 [most disadvantaged] v quintile 5 [least disadvantaged]: HR, 1.44; 95% CI, 1.17–2.79; P = 0.008) (online Appendix, table and figure 1); however, neither factor was significant in the multivariate analysis (Box 5). Relative survival declined steadily with age, but did not differ significantly between the four 5-year periods (Box 5).
Peripheral T-cell lymphomas
Five-year relative survival declined from 45% (95% CI, 36–53%) during 1993-1997 to 37% (95% CI, 29–45%) during 2008–2012 (P = 0.016) (Box 2); the 5-year overall survival was similar across the study period (1993–1997, 48%; 2008–2012, 38%; P = 0.36) (Box 3, E).
Relative survival was significantly influenced in the univariate analysis by place of residence (HR, 1.25; 95% CI, 1.01–1.56; P = 0.042) (online Appendix, table and figure 2), but not in the multivariate analysis (HR, 1.27; 95% CI, 0.99–1.64; P = 0.06). Relative survival was not significantly influenced by socio-economic status, but declined steadily with age (Box 5).
Discussion
We examined whether relative survival has improved for patients with different lymphoma subtypes in Australia since 1993. We found that 5-year relative survival increased significantly between 1993–1997 and 2008–2012 for people with the most frequent B-cell non-Hodgkin lymphoma subtypes (DLBCL, follicular lymphoma) and for people with the less common highly aggressive lymphomas. Conversely, relative survival for patients with Hodgkin lymphoma and PTCL did not improve. We examined whether there was a survival disadvantage for patients with lymphoma living in locations that are rural or have a lower socio-economic status; the only statistically significant finding was that survival was lower for rural residents with DLBCL than for urban patients.
Significant improvements in relative survival were evident for B-cell non-Hodgkin lymphoma subtypes after the introduction of rituximab as first-line therapy. The 13 percentage point increase in overall survival and 17 percentage point increase in relative survival for people with DLBCL after the introduction of rituximab was the first major improvement in outcome since the introduction of CHOP chemotherapy in the 1970s;16 the improvement for people with follicular lymphoma was similar in magnitude. These findings are consistent with the reported results of randomised trials3-5 and registry studies.6 Rituximab was not available during the study period for treating highly aggressive lymphomas, such as Burkitt lymphoma; the improvement in relative survival for these lymphomas coincided with the widespread uptake of brief, high intensity chemotherapy regimens inspired by those employed in paediatric oncology.17,18
The lack of improvement in relative survival for patients with Hodgkin lymphoma or PTCLs is consistent with other reports.19,20 The relative survival rate for Hodgkin lymphoma was already high during 1993–1997 (81%), and novel agents (such as brentuximab vedotin and PD1 inhibitors) were not available until after 2012. Conversely, the outcomes of CHOP chemotherapy for patients with PTCL are still poor, and this indicates an unmet medical need.
Our finding that relative survival was lower for rural patients with DLBCL than for urban patients data is consistent with overseas reports of lower survival rates among people with lymphoma in regional communities or with solid cancer.21,22 Relative survival was also lower for rural patients with follicular lymphoma, Hodgkin lymphoma, or PTCL, but the differences were not statistically significant in our multivariate analysis. Higher age, more advanced disease, worse performance status, lower curative chemotherapy administration rates, and delays in receiving curative chemotherapy have been advanced as reasons for differences in outcomes between rural and urban patients with lymphoma.21 Similarly, higher socio-economic status was associated with higher relative survival of patients with DLBCL, follicular lymphoma, or Hodgkin lymphoma in our univariate analysis, but not in the multivariate analysis. This suggests that the effects of living in rural or disadvantaged areas are modulated by other variables, such as having higher proportions of older patients, for whom survival outcomes are poorer. After adjusting for these factors, our study may not have had the power to detect small differences in relative survival.
In Australia, treatment of lymphoma is universally available through the public health system. Patients with lymphoma during the study period were predominantly treated in tertiary hospitals in capital cities or in a small number of larger regional hospitals. Across the 20-year period, cancer services expanded considerably and new centres were established in regional areas to improve accessibility to therapy. In addition, transfer and support schemes have been introduced to assist rural residents with their travel to tertiary referral centres. To improve their relative survival, patients living in rural or lower socio-economic status areas should be referred to tertiary hospitals early. In contrast to most solid cancers, many lymphoma subtypes, even at an advanced stage, are curable. Although indolent lymphomas such as follicular lymphoma are considered incurable by chemo-immunotherapy, access of patients to effective treatment is clearly associated with improved overall survival.
Limitations
Information regarding disease stage, prognostic information (eg, international prognostic index23), and comorbid conditions is not collected by OASys, so their influence on survival could not be analysed. Place of residence and socio-economic status were determined by the patient’s address at the time of diagnosis, but many patients from remote areas will have travelled to urban centres for treatment. Place of residence and socio-economic status may be less relevant for outcomes, particularly for urgent treatment of patients with aggressive lymphomas.
Conclusion
In our population-based assessment of survival of Queensland people with lymphoma, we found that relative survival significantly improved for patients with B-cell non-Hodgkin lymphoma subtypes (DLBCL, follicular lymphoma) following the introduction of rituximab as first-line therapy, and for patients with highly aggressive lymphomas after the shift to more aggressive chemotherapy regimens. Patients travelling from rural and lower socio-economic status areas to tertiary referral centres should be assisted, to ensure equity of access to effective treatment. Given the geographic size of Australia and the relatively favourable outcomes for patients with most lymphoma subtypes compared with those for patients with solid cancers, it is important that all treating medical practitioners be aware of the benefits of coordinated care in the tertiary setting for rural patients. Our data should serve as a benchmark for future survival analyses in Australia.
Box 1 – Patient characteristics: lymphoma histology subtype, place of residence, socio-economic status
|
|
All lymphoma |
Lymphoma histology subtype |
|||||||||||||
|
Diffuse large B-cell lymphoma |
Follicular lymphoma |
Highly aggressive lymphoma |
Hodgkin lymphoma |
Peripheral T-cell lymphoma |
|||||||||||
|
|
|||||||||||||||
|
Total number of patients |
9509 |
3998 |
3003 |
292 |
1563 |
653 |
|||||||||
|
Sex |
|
|
|
|
|
|
|||||||||
|
Men |
5321 (56%) |
2227 (56%) |
1636 (54%) |
219 (75%) |
834 (53%) |
405 (62%) |
|||||||||
|
Women |
4188 (44%) |
1771 (44%) |
1367 (46%) |
73 (25%) |
729 (47%) |
248 (38%) |
|||||||||
|
Place of residence |
|
|
|
|
|
|
|||||||||
|
Urban |
6584 (69%) |
2785 (70%) |
2062 (69%) |
200 (68%) |
1098 (70%) |
439 (67%) |
|||||||||
|
Rural |
2893 (30%) |
1206 (30%) |
934 (31%) |
91 (31%) |
455 (29%) |
207 (32%) |
|||||||||
|
Data missing |
32 (< 1%) |
7 (< 1%) |
7 (< 1%) |
1 (< 1%) |
10 (1%) |
7 (1%) |
|||||||||
|
Socio-economic status |
|
|
|
|
|
|
|||||||||
|
Quintile 1 (most disadvantaged) |
1621 (17%) |
677 (17%) |
538 (18%) |
45 (15%) |
246 (16%) |
115 (18%) |
|||||||||
|
Quintiles 2–4 (middle) |
6346 (67%) |
2721 (68%) |
1988 (66%) |
194 (66%) |
1015 (65%) |
428 (66%) |
|||||||||
|
Quintile 5 (least disadvantaged) |
1510 (16%) |
593 (15%) |
470 (16%) |
52 (18%) |
292 (19%) |
103 (16%) |
|||||||||
|
Data missing |
32 (< 1%) |
7 (< 1%) |
7 (< 1%) |
1 (< 1%) |
10 (1%) |
7 (1%) |
|||||||||
|
|
|||||||||||||||
|
|
|||||||||||||||
Box 2 – Five-year relative survival (with 95% confidence intervals) for each lymphoma histology subtype, 1993–2012, by 5-year period
Box 5 – Relative survival, by lymphoma subtype: multivariate analysis
|
|
Lymphoma histology subtype |
||||||||||||||
|
Diffuse large B-cell lymphoma |
Follicular lymphoma |
Highly aggressive lymphoma |
Hodgkin lymphoma |
Peripheral T-cell lymphoma |
|||||||||||
|
HR (95% CI) |
P |
HR (95% CI) |
P |
HR (95% CI) |
P |
HR (95% CI) |
P |
HR (95% CI) |
P |
||||||
|
|
|||||||||||||||
|
Sex |
|
|
|
|
|
|
|
|
|
|
|||||
|
Women |
1 |
|
1 |
|
1 |
|
1 |
|
1 |
|
|||||
|
Men |
1.24 (1.12–1.37) |
< 0.001 |
1.25 (1.06–1.46) |
0.006 |
0.68 (0.42–1.09) |
0.10 |
1.24 (0.95–1.61) |
0.11 |
1.21 (0.97–1.50) |
0.09 |
|||||
|
Residence |
|
|
|
|
|
|
|
|
|
|
|||||
|
Urban |
1 |
|
1 |
|
1 |
|
1 |
|
1 |
|
|||||
|
Rural |
1.14 (1.01–1.28) |
0.034 |
1.16 (0.96–1.41) |
0.12 |
0.79 (0.45–1.37) |
0.40 |
1.21 (0.89–1.65) |
0.21 |
1.27 (0.99–1.64) |
0.06 |
|||||
|
Socio-economic status |
|
|
|
|
|
|
|
|
|
|
|||||
|
Quintile 1 (most disadvantaged) |
1.15 (0.94–1.39) |
0.17 |
1.33 (0.97–1.82) |
0.07 |
1.91 (0.82–4.47) |
0.13 |
1.26 (0.77–2.06) |
0.36 |
0.85 (0.56–1.30) |
0.47 |
|||||
|
Quintiles 2–4 (middle) |
1.12 (0.97–1.30) |
0.13 |
1.20 (0.94–1.54) |
0.14 |
1.26 (0.69–2.32) |
0.46 |
1.19 (0.82–1.74) |
0.36 |
1.02 (0.75–1.40) |
0.88 |
|||||
|
Quintile 5 (least disadvantaged) |
1 |
|
1 |
|
1 |
|
1 |
|
1 |
|
|||||
|
Age group (years) |
|
|
|
|
|
|
|
|
|
|
|||||
|
15–24 |
0.47 (0.27–0.81) |
0.006 |
NA |
NA |
0.39 (0.18–0.85) |
0.018 |
0.14 (0.08–0.25) |
< 0.001 |
0.12 (0.03–0.49) |
0.003 |
|||||
|
25–34 |
0.45 (0.29–0.69) |
< 0.001 |
0.45 (0.20–1.02) |
0.06 |
0.46 (0.19–1.11) |
0.08 |
0.12 (0.06–0.23) |
< 0.001 |
0.54 (0.29–1.03) |
0.06 |
|||||
|
35–44 |
0.82 (0.63–1.08) |
0.16 |
0.63 (0.41–0.97) |
0.037 |
0.46 (0.18–1.18) |
0.11 |
0.23 (0.13–0.42) |
< 0.001 |
0.90 (0.56–1.44) |
0.65 |
|||||
|
45–54 |
0.86 (0.69–1.07) |
0.18 |
0.62 (0.44–0.86) |
0.004 |
0.56 (0.24–1.30) |
0.177 |
0.33 (0.18–0.60) |
< 0.001 |
0.78 (0.52–1.16) |
0.22 |
|||||
|
55–64 |
1 |
|
1 |
|
1 |
|
1 |
|
1 |
|
|||||
|
65–74 |
1.79 (1.51–2.10) |
< 0.001 |
2.11 (1.67–2.67) |
< 0.001 |
1.76 (0.86–3.57) |
0.12 |
2.06 (1.40–3.05) |
< 0.001 |
2.12 (1.55–2.89) |
< 0.001 |
|||||
|
75–84 |
3.64 (3.12–4.26) |
< 0.001 |
3.86 (3.05–4.89) |
< 0.001 |
2.64 (1.24–5.62) |
0.012 |
3.10 (2.03–4.72) |
< 0.001 |
2.59 (1.89–3.54) |
< 0.001 |
|||||
|
85 or older |
6.93 (5.73–8.38) |
< 0.001 |
8.27 (5.96–11.47) |
< 0.001 |
1.24 (0.42–3.65) |
0.69 |
22.27 (13–38.16) |
< 0.001 |
5.05 (3.12–8.16) |
< 0.001 |
|||||
|
Rituximab era* |
|
|
|
|
|
|
|
|
|
|
|||||
|
No |
1 |
|
1 |
|
1 |
|
1 |
|
1 |
|
|||||
|
Yes |
0.56 (0.51–0.62) |
< 0.001 |
0.47 (0.39–0.58) |
< 0.001 |
NA |
|
NA |
|
NA |
|
|||||
|
Year group† |
|
|
|
|
|
|
|
|
|
|
|||||
|
1993–1997 |
NA |
|
NA |
|
1 |
|
1 |
|
1 |
|
|||||
|
1998–2002 |
NA |
|
NA |
|
0.60 (0.32–1.12) |
0.11 |
1.00 (0.68–1.46) |
0.99 |
1.23 (0.89–1.69) |
0.21 |
|||||
|
2003–2007 |
NA |
|
NA |
|
0.29 (0.15–0.54) |
< 0.001 |
0.75 (0.51–1.09) |
0.13 |
1.07 (0.78–1.46) |
0.67 |
|||||
|
2008–2012 |
NA |
|
NA |
|
0.56 (0.31–1.00) |
0.05 |
0.96 (0.68–1.37) |
0.84 |
1.15 (0.85–1.56) |
0.37 |
|||||
|
|
|||||||||||||||
|
HR = hazard ratio; NA = not applicable. * For diffuse large B-cell lymphoma: from July 2003 for patients aged 60 years or more, from April 2005 for those under 60; for patients with untreated advanced stage follicular lymphoma: from December 2006. † Multivariate analysis for diffuse large B-cell lymphoma and follicular lymphoma was performed according to rituximab availability, not year group. |
|||||||||||||||
Received 29 September 2017, accepted 10 May 2018
- Fraser Wright1
- Greg Hapgood2
- Aravi Loganathan2
- Nathan Dunn3
- Shoni Philpot3
- Julie Moore3
- Peter Mollee2,4
- 1 Royal Brisbane and Women's Hospital, Brisbane, QLD
- 2 Princess Alexandra Hospital, Brisbane, QLD
- 3 Queensland Cancer Control Analysis Team, Queensland Health, Brisbane, QLD
- 4 University of Queensland, Brisbane, QLD
* Denotes equal first authors.
No relevant disclosures.
- 1. Australian Government Cancer Australia. Lymphoma statistics. Updated June 2017. https://lymphoma.canceraustralia.gov.au/statistics (viewed June 2018).
- 2. Coiffier B, Lepage E, Briere J, et al. CHOP chemotherapy plus rituximab compared with CHOP alone in elderly patients with diffuse large-B-cell lymphoma. N Engl J Med 2002; 346: 235-242.
- 3. Marcus R, Imrie K, Belch A, et al. CVP chemotherapy plus rituximab compared with CVP as first-line treatment for advanced follicular lymphoma. Blood 2005; 105: 1417-1423.
- 4. Pfreundschuh M, Trumper L, Osterborg A, et al. CHOP-like chemotherapy plus rituximab versus CHOP-like chemotherapy alone in young patients with good-prognosis diffuse large-B-cell lymphoma: a randomised controlled trial by the MabThera International Trial (MInT) Group. Lancet Oncol 2006; 7: 379-391.
- 5. Sehn LH, Donaldson J, Chhanabhai M, et al. Introduction of combined CHOP–rituximab therapy dramatically improved outcome of diffuse large B-cell lymphoma in British Columbia. J Clin Oncol 2005; 23: 5027-5033.
- 6. Yu XQ, Chen WH, O’Connell DL. Improved survival for non-Hodgkin lymphoma patients in New South Wales, Australia. BMC Cancer 2010; 10: 231.
- 7. Chen TY, Morrell S, Thomson W, et al. Survival from breast, colon, lung, ovarian and rectal cancer by geographical remoteness in New South Wales, Australia, 2000–2008. Aust J Rural Health 2015; 23: 49-56.
- 8. Yu XQ, Luo Q, Smith DP, et al. Geographic variation in prostate cancer survival in New South Wales. Med J Aust 2014; 200: 586-590. <MJA full text>
- 9. Baade PD, Yu XQ, Smith DP, et al. Geographic disparities in prostate cancer outcomes — review of international patterns. Asian Pac J Cancer Prev 2015; 16: 1259-1275.
- 10. Australian Bureau of Statistics. Australian Standard Geographical Classification (ASGC). Updated June 2014. http://www.abs.gov.au/websitedbs/D3310114.nsf/home/Australian+Standard+Geographical+Classification+(ASGC) (viewed Apr 2018).
- 11. Australian Bureau of Statistics. Socio-Economic Indexes for Areas. Updated Mar 2018. http://www.abs.gov.au/websitedbs/censushome.nsf/home/seifa (viewed Apr 2018).
- 12. Ederer F, Heise H. Instructions to IBM 650 programmers in processing survival computations (Methodological note no. 10). Bethesda (MD): End Results Evaluation Section, National Cancer Institute, 1959.
- 13. Australian Bureau of Statistics. 3235.0. Population by age and sex, regions of Australia, 2015. Aug 2016. http://www.abs.gov.au/AUSSTATS/abs@.nsf/DetailsPage/3235.02015?OpenDocument (viewed June 2018).
- 14. Esteve J, Benhamou E, Croasdale M, et al. Relative survival and the estimation of net survival: elements for further discussion. Stat Med 1990; 9: 529-538.
- 15. Dickman PW, Sloggett A, Hills M, et al. Regression models for relative survival. Stat Med 2004; 23: 51-64.
- 16. McKelvey EM, Gottlieb JA, Wilson HE, et al. Hydroxyldaunomycin (Adriamycin) combination chemotherapy in malignant lymphoma. Cancer 1976; 38: 1484-1493.
- 17. Magrath I, Adde M, Shad A, et al. Adults and children with small non-cleaved-cell lymphoma have a similar excellent outcome when treated with the same chemotherapy regimen. J Clin Oncol 1996; 14: 925-934.
- 18. Mead GM, Sydes MR, Walewski J, et al. An international evaluation of CODOX-M and CODOX-M alternating with IVAC in adult Burkitt’s lymphoma: results of United Kingdom Lymphoma Group LY06 study. Ann Oncol 2002; 13: 1264-1274.
- 19. Hapgood G, Zheng Y, Sehn LH, et al. Evaluation of the risk of relapse in classical Hodgkin lymphoma at event-free survival time points and survival comparison with the general population in British Columbia. J Clin Oncol 2016; 34: 2493-2500.
- 20. Xu B, Liu P. No survival improvement for patients with angioimmunoblastic T-cell lymphoma over the past two decades: a population-based study of 1207 cases. PLoS One 2014; 9: e92585.
- 21. Lee B, Goktepe O, Hay K, et al. Effect of place of residence and treatment on survival outcomes in patients with diffuse large B-cell lymphoma in British Columbia. Oncologist 2014; 19: 283-290.
- 22. Loberiza FR, Cannon AJ, Weisenburger DD, et al. Survival disparities in patients with lymphoma according to place of residence and treatment provider: a population-based study. J Clin Oncol 2009; 27: 5376-5382.
- 23. Shipp M, Harrington D, Andersen J, et al. A predictive model for aggressive non-Hodgkin’s lymphoma: the International NHL Prognostic Factors Project. N Engl J Med 1993; 329: 987-994.
Abstract
Objective: To evaluate relative survival of patients in Queensland with different lymphoma subtypes; to determine whether outcomes have improved with recent changes in treatment; to evaluate relative survival according to place of residence and socio-economic status.
Design: Retrospective population-based study; analysis of data from the Oncology Analysis System, an online reporting tool for cancer incidence and outcomes in Queensland.
Participants: Patients over 15 years of age diagnosed with lymphoma in Queensland during 1993–2012.
Main outcome measures: Relative survival by lymphoma subtype; influence of place of residence and socio-economic status, age group, sex, year of diagnosis (in 5-year bands), and Pharmaceutical Benefits Scheme funding of rituximab for treating B-cell lymphomas on relative survival.
Results: 9509 people (56% men) were diagnosed with lymphoma during 1993–2012. Five-year relative survival improved significantly between 1993–1997 and 2008–2012 for patients with diffuse large B-cell lymphoma (47%; 95% CI, 42–51% v 64%; 95% CI, 61–67%) or follicular lymphoma (62%; 95% CI, 57–66% v 88%; 95% CI, 85–90%; each P < 0.001). Rituximab became available for treating these subtypes during 2003–2006. There was no change in relative survival for patients with Hodgkin lymphoma (81%; 95% CI, 76–85% v 80%; 95% CI, 75–84%; P = 0.22). The only statistically significant difference according to place of residence or socio-economic status was inferior relative survival for rural residents with diffuse large B-cell lymphoma (hazard ratio, 1.14; 95% CI, 1.01–1.28).
Conclusion: Relative survival for patients with B-cell non-Hodgkin lymphoma improved significantly with the introduction of rituximab as first-line therapy in Australia.