


The known The interim report of the Medicare Benefits Schedule Review suggested that administrative tasks undertaken by general practitioners (administration, prescription renewals, referrals) were perceived as low value care.
The new Most patients visiting GPs for administrative reasons do so in the context of other health care needs. Additional health care is provided by GPs at most administrative encounters. Care planning and coordination were undertaken at a large proportion of administrative encounters, particularly for patients with chronic diseases.
The implications Most GP administrative encounters do not constitute low value care; instead, GPs provide hidden value care at consultations initiated by patients requesting administrative tasks.
The review by the Australian government of the Medicare Benefits Schedule (MBS) has triggered conversations about maximising the efficiency and effectiveness of health care for the Australian community, particularly about how “low value care” should be defined, and by whom.1 The interim report of the MBS Review Taskforce defines low value care as “use of an intervention where evidence suggests it confers no or very little benefit on patients, or risk of harm exceeds likely benefit, or, more broadly, the added costs of the intervention do not provide proportional added benefits.”2
The MBS Review Taskforce interim report highlighted a perception among those who responded to the consultation survey that visits to general practitioners for medical certificates, repeat prescriptions and referrals (ie, administrative visits) were of low value, and subsequent media reports suggested that such visits were responsible for a health budget “blowout”.3 The interim report noted that the respondent group of health professionals during the consultation process was dominated by allied health care providers with an interest in having more of their services available through the MBS without patients requiring a referral from a GP.2 Media controversy and a Twitter campaign followed a radio interview by the Health Minister that coincided with the report's release.
Little information, however, is available about whether administrative visits to GPs actually represent low value care. The concept of low value care had its inception in the United States, from where the “Choosing Wisely” campaign has spread to many countries, including Australia. We should be judicious about how we allocate health resources and minimise harm to our patients, but the role of the GP in care coordination deserves greater consideration, particularly as people in our ageing societies are living longer with chronic disease. GPs in Australia are trained to take the initiative in preventing disease and promoting healthy practices, and to provide patient-centred, holistic care.
In the study reported in this article, we investigated whether administrative visits to GPs for medical certificates, repeat prescriptions and referrals met the definition of low value care cited by the interim report of the MBS Taskforce.2 We analysed data from the Bettering Evaluation and Care of Health (BEACH) dataset. This dataset documents the range of problems managed by GPs during these encounters and the types of management subsequently undertaken, providing a unique resource for exploring the frequency of these visits and assessing whether they represent low value care. Further, we investigated whether an opportunity cost might be associated with shifting administrative, medication and referral tasks from GPs, as doctors can deliver additional health care to patients during visits for these purposes.
Methods
We analysed BEACH data collected during April 2000 – March 2016. BEACH was a continuous national, cross-sectional survey of GP activity in Australia. Its methods have been described in detail elsewhere.4 Briefly, each year about 1000 randomly sampled GPs recorded on structured paper forms the details of 100 consecutive encounters with patients who had provided consent. About 80% of the GPs who agreed to participate provided complete data records each year. The age and sex distributions of patients at consultations included in the BEACH surveys accurately reflected the age–sex distribution of patients at all GP service encounters for which Medicare claims had been made.4
Details recorded for each encounter included the patient’s characteristics, one to three reasons (given by the patient) for the encounter, problems managed (one to four), medications (prescribed, advised, or supplied), pathology or imaging tests ordered, and any other clinical or procedural management actions provided by the GP. All actions were directly linked by the GP with the problem managed. The reasons for the encounters, problems managed, clinical and procedural treatments, referrals, pathology and imaging test orders were classified according to the International Classification of Primary Care (version 2) (ICPC-2)5 after being coded according to Australian ICPC-2 PLUS terminology.6,7 ICPC-2 has a biaxial structure, with 17 chapters for body systems on one axis (each with an alphabetic code) and seven components on the second (individual items denoted by numeric codes).
We defined “potentially low value care encounter” as one at which the patient nominated at least one administrative service, medication, or referral request among their reasons for the encounter. We used ICPC-2 codes to define administration (ICPC-2 code 62), medication (ICPC-2 code 50) and referral request reasons (ICPC-2 codes 66–68 in any chapter) for the encounter. We further grouped the administrative codes into three categories (care planning and coordination, certification, other) (online Appendix).
We first determined the proportions of encounters for which the patient’s reason for the encounter was a request for at least one potentially low value care item (“potentially low value care request encounters”) for each BEACH year (April–March) from 2000–01 to 2015–16. As a patient could request different types of potentially low value care items at the same encounter, an encounter could, for example, be classified both as a medication request and a referral request encounter. We then repeated the analysis, but restricted it to patient encounters in which a request for a potentially low value care item was the sole reason for the encounter (“potentially low value care request only encounters”); this included encounters at which patients made multiple requests for the same type of potentially low value care, such as two separate requests for administration tasks (eg, wellness certificate and a driver’s licence check). We then examined management actions undertaken at potentially low value care request encounters during April 2015 – March 2016. Finally, we examined the ten most frequently managed problems at the potentially low value care request only encounters.
Statistical methods
The BEACH survey employed a single stage cluster design (100 patient encounters for each GP). Proportions and robust 95% confidence intervals (CIs) were calculated by survey means procedures in SAS 9.4 (SAS Institute), adjusted for the cluster design. Statistical significance of differences was defined as non-overlapping 95% CIs.
Ethics approval
During the data collection period assessed by this study (April 2000 – March 2016), the BEACH program was approved by the Human Research Ethics Committee of the University of Sydney (reference, 2012/130). The Australian Institute of Health and Welfare Ethics Committee approved the BEACH study during the period the two organisations were affiliated (2000–10).
Results
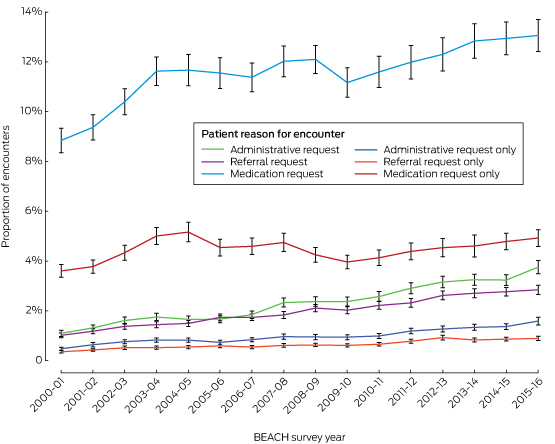
From 2000–01 to 2015–16, 15 681 GPs recorded information about 1 568 100 encounters with patients for the BEACH survey. During 2015–16, 18.5% (95% CI, 17.7–19.3%) of 97 398 encounters included at least one potentially low value care request: 3.8% (95% CI, 3.5–4.0%) for administration work, 2.8% (95% CI, 1.7–3.0%) for a referral, and 13.1% (95% CI, 12.4–13.7%) for a medication. However, potentially low value care request only encounters were relatively infrequent (7.4% [95% CI, 7.0–7.9%]) of all encounters: 1.6% for an administrative request only; 0.9% for a referral request only, 4.9% for a medication request only).
From 2000–01 to 2015–16, the proportions of encounters involving a potentially low value care request increased 3.4-fold for requests for an administrative action, 2.8-fold for referral requests, and by about 1.5-fold for medication requests. The increases in the proportions of potentially low value care request only encounters were similar (administrative only, 3.3-fold; referral only, 2.5-fold; medication only, 1.4-fold increase). The ratio of potentially low value care request encounters to potentially low value care request only encounters remained fairly steady throughout the 16-year period (Box 1).
During 2015–16, 35.4% of GP encounters for which an administrative request was among the reasons for the visit were for care planning and coordination, 33.5% were for certification, and 31.2% for other reasons (eg, legal, welfare and insurance reports). Of the administrative request only encounters, 38.7% were for certification and 29.3% for care planning and coordination. Additional health care was provided at 69.6% of administrative request visits, while GPs did not record any management for 30.7% of administrative request only encounters (Box 2).
At 57.9% of the general practice visits during 2015–16 for which a medication request was one of the reasons, further health care beyond that requested was provided, including advice, counselling and education (23.4% of all encounters) and pathology test ordering (16.7%). Additional health care was also provided at 35.5% of medication only request encounters, including advice, education and counselling (15.8%) and pathology test ordering (9.2%) (Box 2).
A new referral was not provided at 20.1% of encounters for which a referral request was one of the reasons, while additional health care was provided at 69.4% of encounters (including advice, education and counselling at 23.5% of visits). Only 0.9% of all GP–patient encounters were referral request only encounters.
Box 3 summarises the types of problems managed at potentially low value care request only encounters during 2015–16. The most frequently managed problems at administrative request only encounters (apart from administrative problems) were diabetes (7.5 per 100 administrative request only encounters), back complaints (4.1 per 100) and depression (3.7 per 100). Hypertension was the most commonly managed problem at medication request only encounters (17.4 per 100 medication request only encounters), followed by medications (as the problem label, 14.3 per 100), depression (8.6 per 100), and gastro-oesophageal reflux disease (7.4 per 100). The most frequently managed problems at referral request only encounters, apart from referral (as a problem label), were depression (5.2 per 100 referral request only encounters), hypertension (3.5 per 100), and diabetes (3.2 per 100).
Discussion
We found that relatively few encounters in Australian general practice (7.4%) were potentially low value care request only encounters; 18.5% of encounters included a request for potentially low value care tasks. On the other hand, additional health care was provided at most potentially low value care encounters (69.6% of administrative, 57.9% of medication, and 69.4% of referral request visits). This suggests that patients are most likely to present with administrative, medication and referral requests in the context of a visit for other health needs. The overall rate of administrative, medication and referral request encounters in general practice has risen over the past 15 years, but the rates of increase in potentially low value care and potentially low value care only encounters were similar.
A substantial proportion of administrative tasks for Australian GPs involve care planning and coordination. Visits to GPs motivated by medication requests often resulted in the GP affording additional health care, including managing other problems, providing education and advice, and pathology testing. The most common problems managed at the potentially low value care only encounters were chronic diseases, for which continuity and coordination of care are important. Depression was the problem most frequently managed at referral request only encounters; this is probably associated with the GP completing mental health care plans that enable patients to receive subsidised care from a psychologist as part of the management.
There are very few alternative sources of encounter data with which to compare our findings, but it is widely recognised that achieving the highest quality health care possible requires that value-based health care be patient-focused and that health resources be judiciously allocated.8-10 Identifying and defining low value care continues to be challenging.10 The high proportion of administrative request encounters at which care planning and coordination were undertaken (35.4%) is encouraging, given the evidence that they can improve health, self-management and psychological outcomes in patients with long term health conditions.11 As the workload in this area increases for GPs, however, the MBS review must ensure that care planning continues to be comprehensive, intensive and integrated, as this maximises its benefits. Calls for direct access of patients to allied health care claimable from Medicare must be considered carefully by the review to ensure that any loosening of controls is consistent with the evidence for its benefit and safety.
It has been suggested during the review and in the media that pharmacists should be permitted to directly provide health certificates and medications to patients.12 However, our results indicate that most medication requests to GPs result in additional health care being provided during the visit. Losing this important opportunity for comprehensive and integrated care could be detrimental to patients.
We were not able to fully explore the role of health care stewardship by GPs, but this important aspect deserves greater attention before policies are changed. Direct access to specialists and allied health care may increase health care costs, and potentially undermine the important coordination role we have highlighted. Recent studies in the United Kingdom and the Netherlands have underlined the importance of strengthening the stewardship by GPs of patients’ access to medical specialists, and their authors have called for caution in reducing their gatekeeper role.13,14
One limitation of our study is related to the fact that no management was recorded for 30.7% of encounters at which patients requested administrative work only; further, administrative work was recorded for only 40.8% of these encounters. While the GP may not have provided the requested administrative action at some of these encounters because it was not clinically appropriate, it is unlikely to explain the high level of encounters that resulted in no specific management of any type. We suspect that this might be explained by GPs not recording administrative work performed as a separate activity, perhaps assuming that it was clear that administrative work had been done after recording that the patient had requested it as a reason for the encounter or recording it as the problem managed. There may have been some misclassification of activities, but we know neither the direction of this bias nor its magnitude.
In summary, our results suggest that most GP administrative encounters included hidden value care rather than low value care, as frequently more than one problem was managed, care was coordinated, and treatment effects were monitored. To shift the administrative, medication and referral tasks of GPs to other members of the health care team may further fragment care for patients with chronic disease, responsible for the largest proportion of these visits in our study.
Conclusion
We found no evidence that GP administrative encounters with patients seeking certificates, medications and referrals should be considered low value care. On the contrary, GP encounters for administrative, medication and referral tasks alone are relatively uncommon in general practice. Most encounters initiated by patients for these purposes lead to the GP providing additional health care, particularly for managing chronic conditions. Moving these tasks from general practice may not save money, but could reduce the continuity and quality of care for patients with chronic diseases.
Box 1 – Proportions of general practitioner–patient encounters in which the patient requested a potential low value care service, by request type and BEACH survey year
BEACH = Bettering Evaluation and Care of Health survey.
Weighted sample size for each BEACH year: 2000–01, 99 307; 2001–02, 96 973; 2002–03, 100 987; 2003–04, 98 877; 2004–05, 94 386; 2005–06, 101 993; 2006–07, 91 805; 2007–08, 95 898; 2008–09, 96 688; 2009–10, 101 349; 2010–11, 95 839; 2011–12, 99 030; 2012–13, 98 564; 2013–14, 95 879; 2014–15, 98 728; 2015–16, 97 398.
Box 2 – Management activities recorded by general practitioners at potentially low value care encounters, Australia, 2015–16*
|
|
Patient’s reason for visit to general practitioner |
||||||||||||||
|
Administrative work |
Medication |
Referral |
|||||||||||||
|
|
|||||||||||||||
|
Potentially low value care request encounters |
|
|
|
||||||||||||
|
Number of encounters (proportion of all encounters) |
3658 (3.8%) |
12 721 (13.1%) |
2772 (2.8%) |
||||||||||||
|
More than one problem managed |
53.2% (50.3–56.1%) |
67.9% (66.2–69.6%) |
64.2% (61.7–66.8%) |
||||||||||||
|
Medication prescribed/advised/supplied |
41.6% (39.3–43.9%) |
97.1% (96.6–97.5%) |
45.5% (43.0–48.0%) |
||||||||||||
|
Administrative work |
39.0% (35.9–42.2%) |
3.0% (2.6–3.5%) |
4.4% (3.3–5.4%) |
||||||||||||
|
Counselling/advice/education |
25.0% (22.2–27.8%) |
23.4% (21.6–25.2%) |
23.5% (20.6–26.4%) |
||||||||||||
|
Procedural treatment |
10.2% (8.7–11.7%) |
16.6% (15.1–18.1%) |
11.2% (9.6–12.8%) |
||||||||||||
|
Pathology tests ordered |
12.6% (11.1–14.0%) |
16.7% (15.7–17.7%) |
16.6% (15.0–18.2%) |
||||||||||||
|
Imaging ordered |
4.1% (3.3–4.8%) |
5.3% (4.8–5.8%) |
7.2% (6.1–8.3%) |
||||||||||||
|
Referrals |
21.3% (19.1–23.4%) |
11.2% (10.3–12.0%) |
79.9% (77.7–82.1%) |
||||||||||||
|
No management recorded |
17.6% (15.6–19.6%) |
1.5% (1.1–1.8%) |
5.4% (4.3–6.4%) |
||||||||||||
|
Requested service only |
12.8% (11.3–14.4%) |
40.7% (38.8–42.6%) |
25.2% (23.0–27.4%) |
||||||||||||
|
Management in addition to service requested |
69.6% (67.2–71.9%) |
57.9% (55.9–59.8%) |
69.4% (67.0%–71.9%) |
||||||||||||
|
Potentially low value care request only encounters |
|
|
|
||||||||||||
|
Number of encounters (proportion of all encounters) |
1551 (1.6%) |
4796 (4.9%) |
888 (0.9%) |
||||||||||||
|
More than one problem managed |
20.6% (17.7–23.6%) |
30.3% (28.0–32.6%) |
16.3% (13.4–19.2%) |
||||||||||||
|
Medication prescribed/advised/supplied |
19.6% (16.8–22.4%) |
96.1% (95.4–96.9%) |
11.8% (9.3–14.2%) |
||||||||||||
|
Administrative work |
40.8% (36.7–44.9%) |
0.8% (0.5–1.1%) |
3.4% (2.0–4.7%) |
||||||||||||
|
Counselling/advice/education |
17.5% (14.5–20.6%) |
15.8% (13.8–17.8%) |
14.2% (11.4–17.0%) |
||||||||||||
|
Procedural treatment |
3.7% (2.4–5.1%) |
10.9% (8.8–13.0%) |
4.2% (2.7–5.8%) |
||||||||||||
|
Pathology tests ordered |
6.6% (4.6–8.6%) |
9.2% (8.0–10.3%) |
6.0% (4.3–7.8%) |
||||||||||||
|
Imaging ordered |
1.6% (0.9–2.4%) |
0.6% (0.4–0.9%) |
2.8% (1.6–3.9%) |
||||||||||||
|
Referrals |
14.5% (11.9–17.1%) |
3.0% (2.4–3.6%) |
81.8% (78.8–84.9%) |
||||||||||||
|
No management recorded |
30.7% (27.2–34.3%) |
2.4% (1.7–3.0%) |
10.0% (7.7–12.4%) |
||||||||||||
|
Requested service only |
23.9% (20.8–26.9%) |
62.2% (59.3–65.0%) |
58.1% (54.2–61.9%) |
||||||||||||
|
Management in addition to service requested |
45.4% (41.6–49.2%) |
35.5% (32.6–38.3%) |
31.9% (28.1–35.7%) |
||||||||||||
|
|
|||||||||||||||
|
* Proportions of specified types of encounters, with 95% confidence intervals. |
|||||||||||||||
Box 3 – Problems most frequently managed at potentially low value care request only encounters, Australia, 2015–16
|
Problems/diagnoses |
Number |
Proportion of problems managed (95% CI) |
Problems managed per 100 encounters of specified type (95% CI) |
||||||||||||
|
|
|||||||||||||||
|
Administrative request only encounters |
1551 |
|
|
||||||||||||
|
Total number of problems managed |
2007 |
|
129.5 (124.5–134.4) |
||||||||||||
|
Administrative: all* |
502 |
25.0% (21.7–28.3%) |
32.4 (28.4–36.4) |
||||||||||||
|
Diabetes* |
116 |
5.8% (4.4–7.1%) |
7.5 (5.7–9.3) |
||||||||||||
|
Back complaint* |
64 |
3.2% (2.3–4.1%) |
4.1 (2.9–5.3) |
||||||||||||
|
Depression* |
58 |
2.9% (2.0–3.8%) |
3.7 (2.6–4.9) |
||||||||||||
|
Hypertension* |
57 |
2.8% (2.0–3.7%) |
3.7 (2.5–4.8) |
||||||||||||
|
Osteoarthritis* |
51 |
2.6% (1.7–3.4%) |
3.3 (2.2–4.4) |
||||||||||||
|
Upper respiratory infection, acute |
41 |
2.0% (1.1–3.0%) |
2.6 (1.4–3.8) |
||||||||||||
|
Injury, musculoskeletal not otherwise specified |
35 |
1.8% (1.1–2.4%) |
2.3 (1.4–3.1) |
||||||||||||
|
General check-up* |
35 |
1.7% (1.1–2.4%) |
2.2 (1.4–3.1) |
||||||||||||
|
Anxiety* |
33 |
1.6% (1.0–2.3%) |
2.1 (1.3–2.9) |
||||||||||||
|
Medication request only encounters |
4796 |
|
|
||||||||||||
|
Total problems managed |
6911 |
|
144.1 (140.5–147.7) |
||||||||||||
|
Hypertension* |
836 |
12.1% (11.2–13.0%) |
17.4 (15.9–19.0) |
||||||||||||
|
Medication: all* |
685 |
9.9% (8.3–11.6%) |
14.3 (12.0–16.5) |
||||||||||||
|
Depression* |
412 |
6.0% (5.3–6.6%) |
8.6 (7.6–9.6) |
||||||||||||
|
Gastroesophageal reflux disease* |
356 |
5.2% (4.5–5.8%) |
7.4 (6.4–8.4) |
||||||||||||
|
Lipid disorders* |
328 |
4.8% (4.2–5.4%) |
6.8 (5.9–7.8) |
||||||||||||
|
Diabetes* |
279 |
4.0% (3.5–4.6%) |
5.8 (5.0–6.7) |
||||||||||||
|
Back complaint* |
198 |
2.9% (2.3–3.4%) |
4.1 (3.4–4.9) |
||||||||||||
|
Anxiety* |
170 |
2.5% (2.0–2.9%) |
3.6 (2.9–4.2) |
||||||||||||
|
Schizophrenia |
165 |
2.4% (1.7–3.1%) |
3.4 (2.5–4.4) |
||||||||||||
|
Oral contraception* |
164 |
2.4% (1.8–2.9%) |
3.4 (2.6–4.2) |
||||||||||||
|
Referral request only encounters |
888 |
|
|
||||||||||||
|
Total problems managed |
1088 |
|
122.5 (118.0–127.0) |
||||||||||||
|
Referral: all* |
141 |
13.0% (10.1–15.8%) |
15.9 (12.5–19.3) |
||||||||||||
|
Depression* |
46 |
4.2% (2.8–5.7%) |
5.2 (3.4–7.0) |
||||||||||||
|
Hypertension* |
31 |
2.8% (1.8–3.9%) |
3.5 (2.1–4.8) |
||||||||||||
|
Diabetes* |
29 |
2.7% (1.7–3.6%) |
3.2 (2.0–4.4) |
||||||||||||
|
Anxiety* |
22 |
2.0% (1.0–3.0%) |
2.5 (1.3–3.6) |
||||||||||||
|
Administrative: all* |
20 |
1.9% (0.6–3.2%) |
2.3 (0.7–3.9) |
||||||||||||
|
Osteoarthritis* |
20 |
1.8% (0.9–2.7%) |
2.2 (1.1–3.3) |
||||||||||||
|
Pregnancy* |
16 |
1.5% (0.7–2.2%) |
1.8 (0.8–2.7) |
||||||||||||
|
Child behaviour symptom/complaint |
15 |
1.4% (0.5–2.3%) |
1.7 (0.7–2.8) |
||||||||||||
|
Infertility/subfertility (women) |
13 |
1.2% (0.4–2.0%) |
1.5 (0.5–2.4) |
||||||||||||
|
|
|||||||||||||||
|
* Includes multiple ICPC–2 or ICPC–2 PLUS codes.4 |
|||||||||||||||
Received 9 March 2017, accepted 14 September 2017
- Lyndal J Trevena
- Christopher Harrison
- Helena C Britt
- Sydney School of Public Health, University of Sydney, Sydney, NSW
No relevant disclosures.
- 1. Scott IA, Duckett SJ. In search of professional consensus in defining and reducing low-value care. Med J Aust 2015; 203: 179-181. <MJA full text>
- 2. Medicare Benefits Schedule Review Taskforce. Interim report to the Minister for Health 2016. Aug 2017. http://www.health.gov.au/internet/main/publishing.nsf/content/mbsr-interim-report (viewed Oct 2017).
- 3. Parnell S. Routine GP tasks blow out Medicare benefits. The Australian (Sydney), 6 Sept 2016. http://www.theaustralian.com.au/national-affairs/health/routine-gp-tasks-blow-out-medicare-benefits/news-story/7f30236fec916315fcbf826e85c46447 (viewed Oct 2017).
- 4. Britt H, Miller G, Henderson J, et al. General practice activity in Australia 2015–16 (General Practice Series No. 40). Sydney: Sydney University Press, 2016. https://ses.library.usyd.edu.au/bitstream/2123/15514/5/9781743325148_ONLINE.pdf (viewed Oct 2017).
- 5. World Organization of National Colleges, Academies, and Academic Associations of General Practitioners/Family Physicians. ICPC-2: International classification of primary care. Oxford: Oxford University Press, 1998.
- 6. National Centre for Classification in Health, University of Sydney. ICPC-2 PLUS: the BEACH coding system [website]. Updated Aug 2016. University of Sydney; http://sydney.edu.au/health-sciences/ncch/icpc-2-plus/overview.shtml (viewed Oct 2017).
- 7. Britt H. A new coding tool for computerised clinical systems in primary care — ICPC plus. Aust Fam Phys 1997; 26 Suppl 2: S79-S82.
- 8. Alvin MD, Horton KM, Johnson PT. Training radiology residents to be stewards in healthcare value. Acad Radiol 2017; 24: 755-756.
- 9. Schwartz AL, Landon BE, Elshaug AG, et al. Measuring low-value care in Medicare. JAMA Int Med 2014; 174: 1067-1076.
- 10. Zywiel MG, Liu TC, Bozic KJ. Value-based healthcare: the challenge of identifying and addressing low-value interventions. Clin Orthop Relat Res 2017; 475: 1305-1308.
- 11. Coulter A, Entwistle VA, Eccles A, et al. Personalised care planning for adults with chronic or long-term health conditions. Cochrane Database Syst Rev 2015; (3): CD010523.
- 12. Haggan M. Sick notes one way to take up GP burden. AJP.com.au [website]; 6 Sept 2016. https://ajp.com.au/news/sick-notes-one-way-take-gp-burden/ (viewed Nov 2017).
- 13. Wammes JJ, Jeurissen PP, Verhoef LM, et al. Is the role as gatekeeper still feasible? A survey among Dutch general practitioners. Fam Pract 2014; 31: 538-544.
- 14. Greenfield G, Foley K, Majeed A. Rethinking primary care’s gatekeeper role. BMJ 2016; 354: i4803.
Abstract
Objective: To determine the frequency of general practice administrative encounters, and to determine whether they represent low value care.
Design: Secondary analysis of data from the Bettering Evaluation and Care of Health (BEACH) dataset.
Setting: 1 568 100 GP–patient encounters in Australia, 2000–01 to 2015–16.
Participants: An annual nationally representative random sample of about 1000 GPs, who each recorded the details of 100 consecutive encounters with patients.
Main outcome measures: Proportions of general practice encounters that were potentially low value care encounters (among the patient’s reasons for the encounter was at least one administrative, medication, or referral request) and potentially low value care only encounters (such reasons were the sole reason for the encounter). For 2015–16, we also examined other health care provided by GPs at these encounters.
Results: During 2015–16, 18.5% (95% CI, 17.7–19.3%) of 97 398 GP–patient encounters were potentially low value care request encounters; 7.4% (95% CI, 7.0–7.9%) were potentially low value care only encounters. Administrative work was requested at 3.8% (95% CI, 3.5–4.0%) of GP visits, 35.4% of which were for care planning and coordination, 33.5% for certification, and 31.2% for other reasons. Medication requests were made at 13.1% (95% CI, 12.4–13.7%) of encounters; other health care was provided at 57.9% of medication request encounters, counselling, advice or education at 23.4%, and pathology testing was ordered at 16.7%. Referrals were requested at 2.8% (95% CI, 1.7–3.0%) of visits, at 69.4% of which additional health care was provided. The problems managed most frequently at potentially low value care only encounters were chronic diseases.
Conclusion: Most patients requested certificates, medications and referrals in the context of seeking help for other health needs. Additional health care, particularly for chronic diseases, was provided at most GP administrative encounters. The MBS Review should consider the hidden value of these encounters.