


The known Almost 70 000 assisted reproductive technology (ART) cycles are performed each year in Australia and New Zealand. Success rates are generally reported per individual cycle attempt, rather than from the overall perspective of a course of ART treatment.
The new This is the first study to report cumulative success rates based on complete ovarian stimulation cycles for women undergoing ART in Australia and New Zealand, and also provides estimates that take into account women who discontinued treatment.
The implications These estimates can be used when counselling women about their likelihood of having a baby using ART treatment, and to inform public policy.
Infertility is experienced by about one in six couples, causing significant personal anguish to millions around the world.1,2 Assisted reproductive technologies (ARTs) such as in vitro fertilisation (IVF) have revolutionised the treatment of infertility. It is estimated that more than 1.8 million ART cycles were undertaken worldwide in 2010, and that more than 6 million children have been conceived using these technologies over the past three decades.3 The Australian and New Zealand Assisted Reproductive Database (ANZARD) recorded 33 750 women having 67 707 ART cycles during 2014, resulting in the births of 12 875 babies; this was one in 25 children born in Australia, and 1 in 12 children to women over 35.4
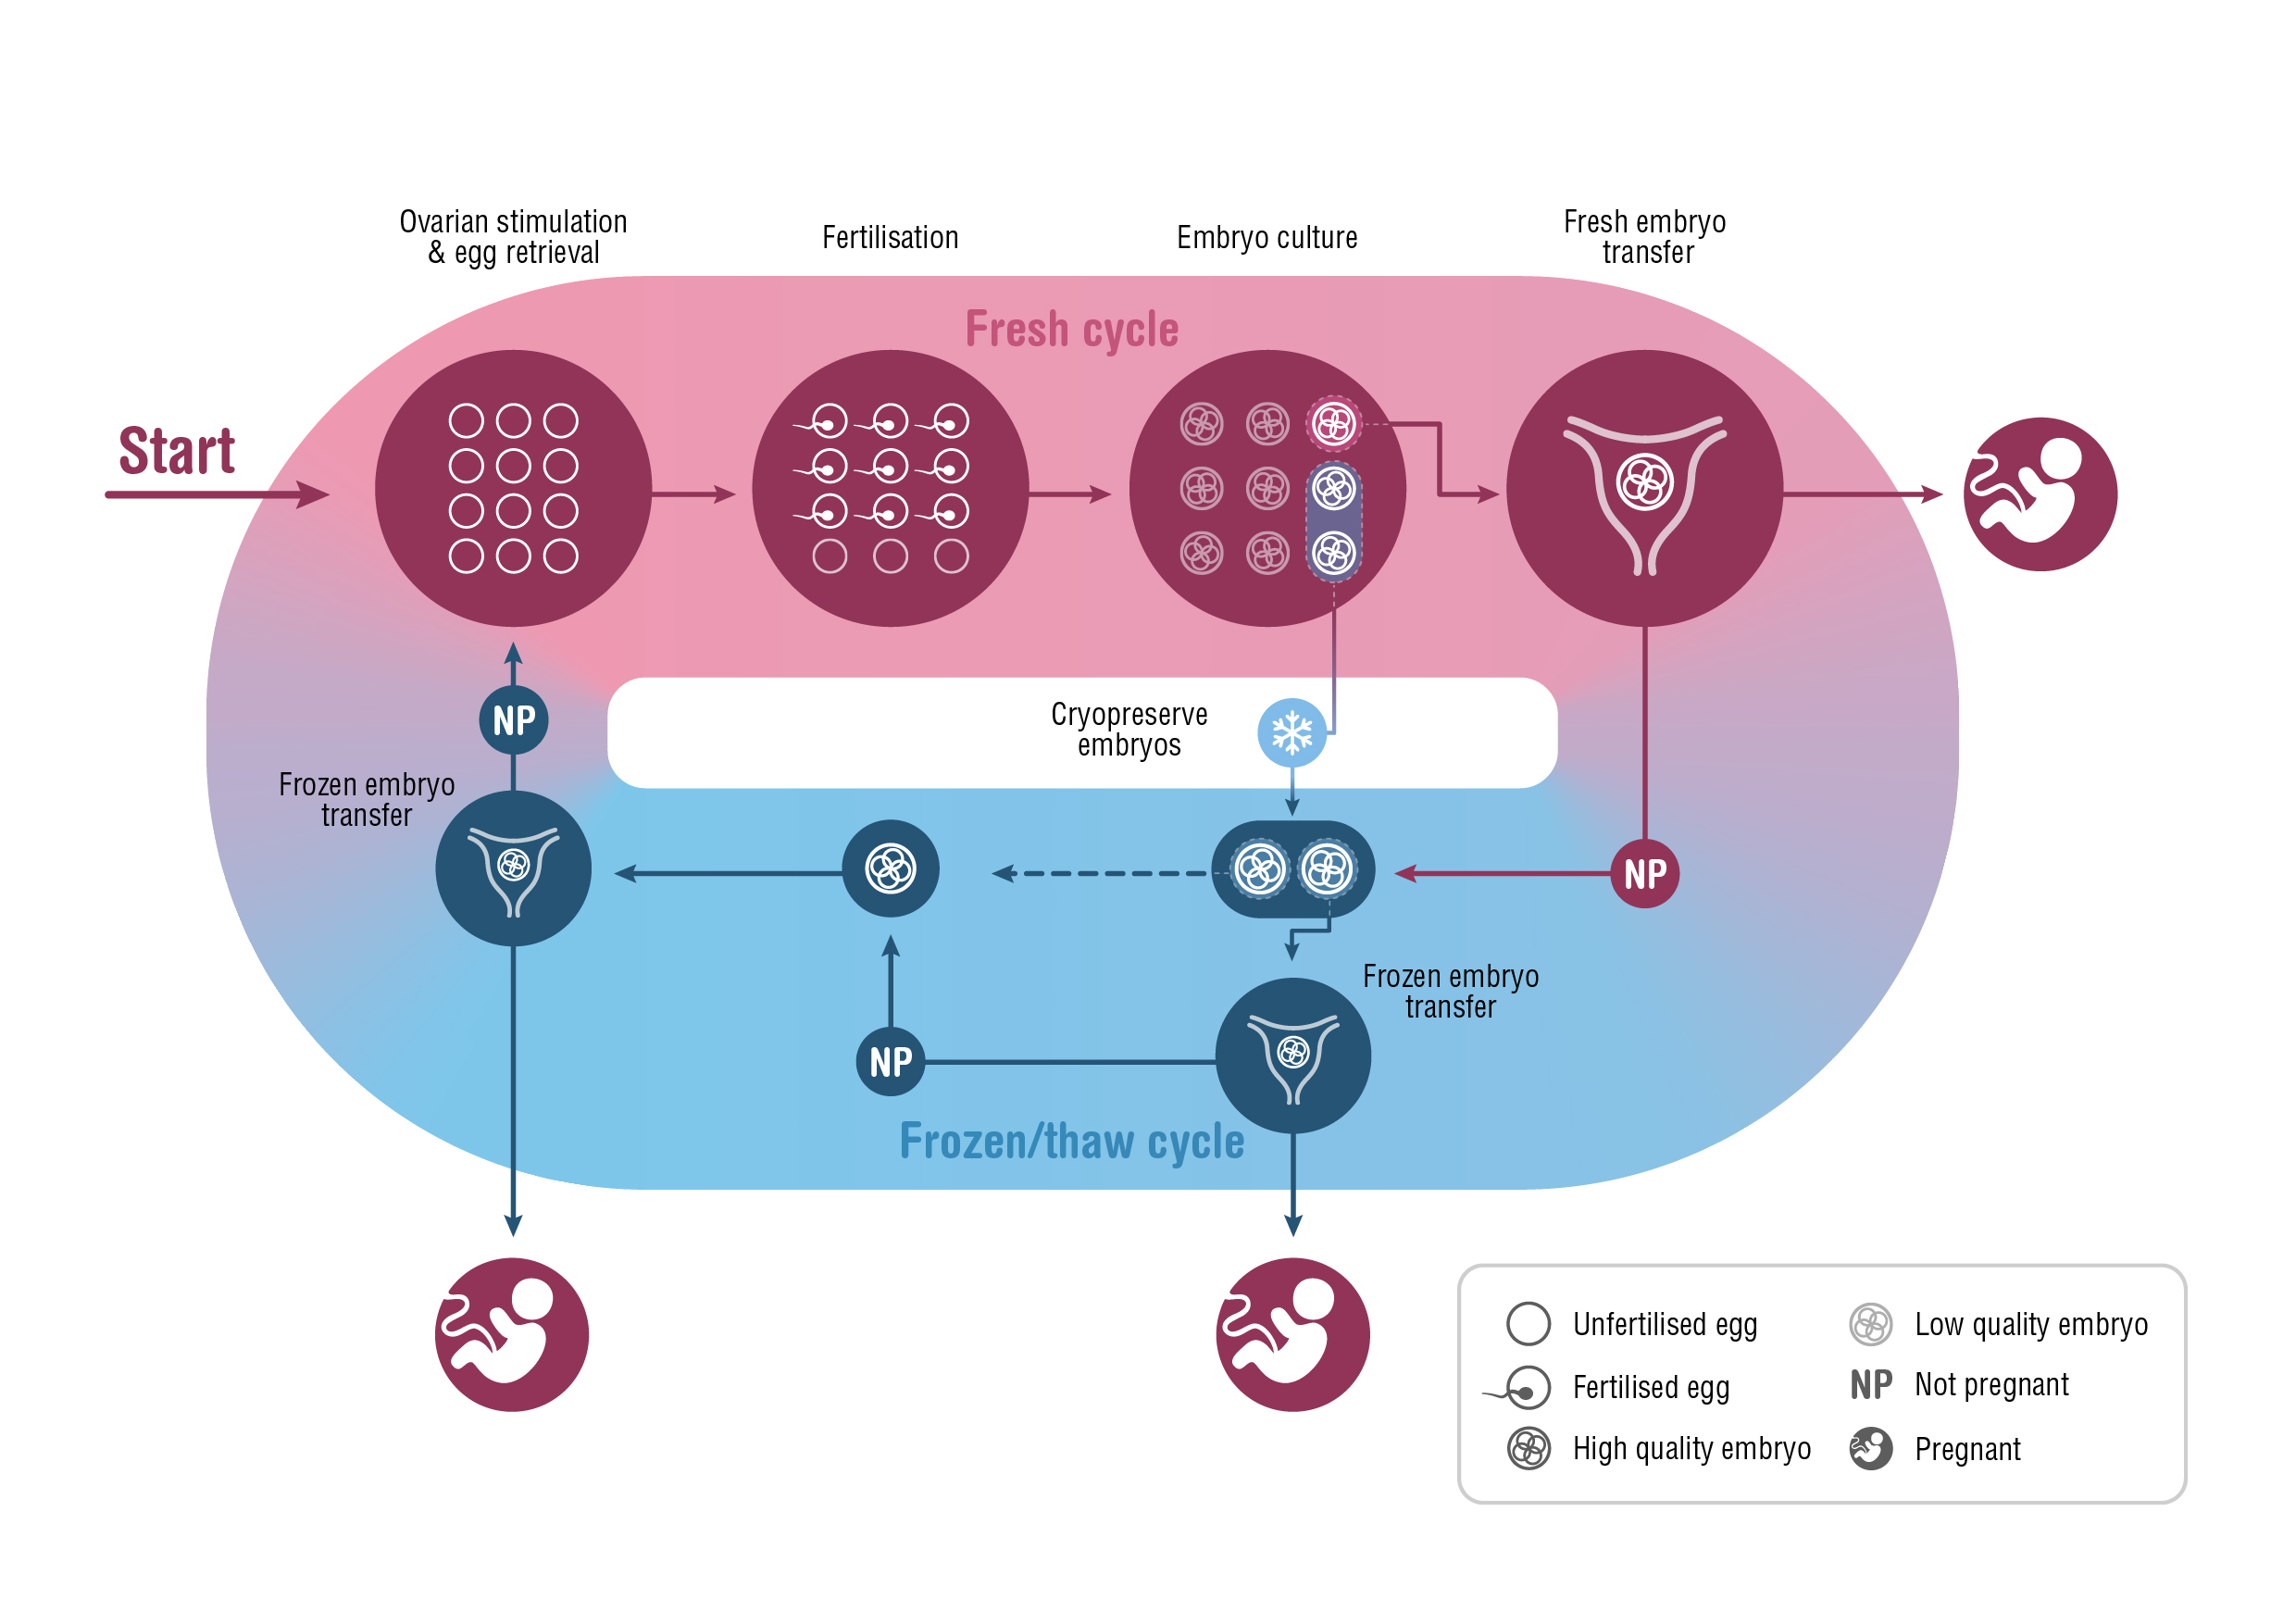
A fresh ART treatment cycle typically involves ovarian stimulation and the retrieval of several mature oocytes (eggs) for fertilisation. The resulting embryos are cultured in vitro for 2–6 days before one or, occasionally, two embryos are transferred to the woman’s uterus. Unused embryos are cryopreserved for potential transfer in subsequent frozen/thaw cycles.
The success rate of ARTs is generally reported as the number of clinical pregnancies or live births per single fresh or frozen/thaw cycle.4-6 However, cryopreservation has become increasingly central to clinical practice over the past decade, calling into question the relevance of this measure of success. The shift to frozen/thaw cycles has been largely driven by the move to single embryo transfers — to minimise the health risks associated with multiple gestation pregnancies — and by strategies that delay embryo transfer, to improve synchronicity between the endometrium and embryo and to accommodate pre-implantation genetic testing. Further, evidence that fetal wellbeing is not harmed by embryo cryopreservation, and higher ART success rates per embryo transfer (particularly with frozen/thaw embryos), have elevated the importance of the cryopreservation program.7-9 This shift in practice means that, when informing patients about the chances of ART success, a more meaningful measure would be based on “complete cycles”, encompassing the outcomes from all fresh and frozen/thaw embryo transfers following one ovarian stimulation10,11 (Box 1).
Our objective was to report the cumulative live birth rate (CLBRs) for all complete ART cycles a woman might undergo, with a minimum 2-year period follow-up from the commencement of her first cycle; that is, to determine the chance of a woman having her first live birth after repeated ART treatment cycles.
Methods
Data
Data were extracted from ANZARD for the 120 930 treatment cycles undertaken during 1 January 2009 – 31 December 2014 by the 56 652 women in Australia and New Zealand commencing autologous ART (with their own oocytes) during 2009–2012. These data allowed 2–6 years’ follow-up of each woman.
ANZARD, managed by the National Epidemiology and Perinatal Statistics Unit of the University of New South Wales, collects information on all ART treatment cycles undertaken in the 90 fertility clinics in Australia and New Zealand. All fertility clinics report ART treatment information to ANZARD as part of their licensing requirements, so that full registration of ART cycles is assumed. Records of all frozen/thaw transfers were linked to the associated episode of ovarian stimulation for each woman. This allowed each complete treatment cycle to be identified, and the reproductive outcome to be measured. Cycles were excluded for women who used donated oocytes or embryos, or surrogacy arrangements, and when the purpose of treatment was the long term storage of oocytes or embryos (eg, onco-fertility preservation).
The follow-up period was chosen to allow sufficient time to achieve at least one live birth and a sufficient number of complete cycles for reliable estimates of live birth rates. Live birth was defined as the birth of at least one infant of at least 20 weeks’ gestation or a minimum 400 g birth weight; ie, the birth of twins or triplets was counted as one live birth. CLBRs were reported according to age group at the commencement of treatment (under 30 years, 30–34 years, 35–39 years, 40–44 years, 45 years or older).
Statistical analysis
Two CLBRs were calculated, according to differing assumptions about the prognosis of women who discontinued ART treatment. The conservative CLBR assumed that women who discontinued treatment would not have achieved a live birth if they had continued; it was calculated for each complete cycle as the proportion of women who commenced ART treatment during 2009–2012 who had achieved a live birth. The 95% confidence intervals (CIs) were calculated from standard errors of the binomial distribution. Women were excluded from analysis once they had achieved their first live birth. Women were considered to have discontinued ART treatment if they did not have a treatment-dependent live birth and did not return for further ART treatment before 31 December 2014. To ensure reliable estimates, the CLBR was calculated for a complete cycle only when at least 50 women had commenced the cycle.
The optimal CLBR assumed that women who discontinued treatment would have had the same chance of a live birth with continued ART as those who did continue; it was estimated (with 95% CIs) by the Kaplan–Meier method.
Women discontinue ART treatment for a number of reasons, but mainly because of the psychological and physical demands of treatment, and its costs.12 Reason for discontinuation is not available in ART registry data, so the conservative and optimal CLBRs provide a range within which the actual CLBR would be expected to fall. To further pursue this question, we performed a sensitivity analysis predicated on varying the assumptions about the probability of future treatment success in women who had discontinued treatment. A recent systematic review found that 38% (95% CI, 24–54%) of women who discontinued treatment after a failed ART cycle had been advised to end treatment (doctor censoring).12 We therefore assumed that 38% could conservatively be expected to have a zero chance of a live birth with their own eggs, and that 62% of women who discontinued treatment without a live birth could be expected to have had the same chance of a live birth as women who continued with treatment (online Appendix 1).
Cycle-specific live birth rates were calculated as the number of live births resulting from a cycle divided by the number of women who commenced that cycle. Analyses were conducted in Stata 14 (StataCorp).
Ethics approval
This study was approved by the University of New South Wales Human Research Ethics Advisory Panel (reference, GHC16983).
Results
Descriptive statistics
The characteristics of the 56 652 women who commenced ART treatment during 2009–2012 and of the 120 930 complete treatment cycles they underwent by 2014 are summarised in Box 2 and online Appendix 2. The median age of women commencing treatment was 35 years (interquartile range [IQR], 31–39 years), 30% presented with infertility caused by female factors, 37% with infertility caused by male or a combination of male and female factors; for 25% of women the cause of infertility was unexplained. Women underwent an average of 2.1 complete cycles, and 3.0 single fresh or frozen/thaw cycles. The median number of oocytes retrieved per fresh stimulated cycle was eight (IQR, 4–12), and 73% of embryo transfer procedures transferred a single embryo. Of the women who commenced treatment, 54.5% achieved at least one live birth; 25.5% of complete cycles resulted in a live birth. The live birth rate per embryo transfer cycle was 22.9% for fresh embryo transfers.
Cycle-specific live birth rates
The live birth rate (first live birth) for the first complete cycle was 32.7% (95% CI, 32.2–33.1%) (Box 3). The cycle-specific live birth rate decreased with increasing maternal age and with increasing cycle number. The highest rates were for the first complete cycle undertaken by women who commenced treatment before the age of 35 (43.7% [95% CI, 42.3–45.1%] for women under 30; 43.4% [95% CI, 42.4–44.4%] for women aged 30–34 years). The lowest live birth rates for the first complete cycle were for women aged 40–44 (10.7%; 95% CI, 10.1–11.3%) and 45 or more (1.4%; 95% CI, 0.8–2.8%) (online Appendix 3).
The discontinuation rates after each complete cycle for women who commenced treatment before 45 years of age were similar for all age groups (23–35% during the first six cycles). Discontinuation rates for women who commenced treatment when 45 years or older were much higher, ranging from 49.1% after the first cycle to 35.2% after the fifth cycle (Box 3 and online Appendix 3).
Cumulative live birth rates
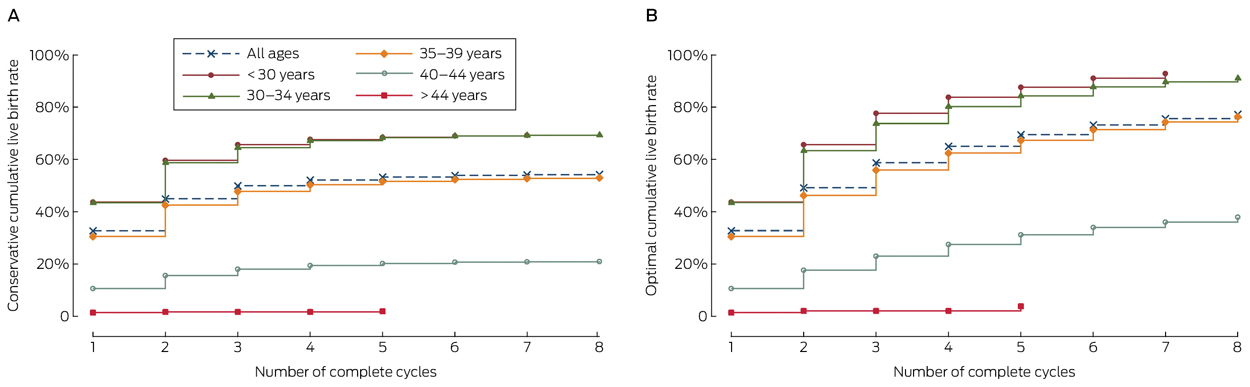
The conservative and optimal CLBRs for up to eight complete cycles are presented in Box 3, Box 4, and online Appendix 3. Overall (ie, for all ages), the CLBR was 32.7% (95% CI, 32.2–33.1%) for the first complete cycle, rising to 54.3% (95% CI, 53.9–54.7%) (conservative) and 77.2% (95% CI, 76.5–77.9%) (optimal) for the eighth cycle.
CLBRs declined with increasing maternal age. For women who commenced ART treatment before 30 years of age, the CLBR for the first complete cycle was 43.7% (95% CI, 42.6–44.7%), rising to 69.2% (95% CI, 68.2–70.1%) (conservative) and 92.8% (95% CI, 91.6–94.0%) (optimal) for the seventh cycle. For women aged 40–44 years when they commenced treatment, the CLBR was 10.7% (95% CI, 10.1–11.3%) for the first complete cycle, rising to 21.0% (95% CI, 20.2–21.8) (conservative) and 37.9% (95% CI, 35.9–39.9%) (optimal) for the eighth cycle (Box 4, online Appendix 3).
The sensitivity analysis found that when the CLBR was adjusted for the proportion of women likely to discontinue ART treatment because of doctor censoring, the CLBR after three complete cycles was 55.2% (95% CI, 56.5–53.8%), closer to the optimal (58.8%) than the conservative rate (49.9%). This finding was similar for all age groups (online Appendix 1).
Discussion
This is the first report of CLBRs based on complete ART treatment cycles derived from population-based Australian and New Zealand fertility clinic data. The perspective of a complete cycle, which links all fresh and frozen/thaw embryo transfers to the associated ovarian stimulation, allows cycle-specific and CLBRs to be calculated. The cycle-specific rates inform women about their chances of their first live birth from one course of ovarian stimulation followed by all embryo transfers. The CLBR informs women about their chances of at least one live birth after a given number of repeated ovarian stimulation cycles. For example, for women commencing ART treatment when aged 30–34 years, the estimated chance of a live birth lies between 64.5% (95% CI, 63.8–65.2%) and 73.6% (95% CI, 72.8–74.4%) after three complete cycles, and the chance of a live birth during the third complete cycle is 28.0% (95% CI, 26.3–29.8%).
ART success rates based on complete cycles are more meaningful than single fresh or frozen/thaw cycle success rates because they provide an overall perspective of a course of ART treatment. Complete cycle CLBRs also account for the shift in routine clinical practice to cryopreservation of embryos, and encourage single embryo transfers by removing the emphasis on single cycle success rates.
Although cycle-specific rates declined with successive cycles, conservative and optimal CLBRs increased for most age groups for up to seven or eight cycles. The exception was women who commenced ART treatment at 45 years of age or later (655 women), of whom only 12 had had a live birth after five complete cycles.
Two recent analyses of data from the Human Fertilisation and Embryology Authority (HFEA) national database (United Kingdom) have also calculated conservative and optimal complete cycle CLBRs.13,14 We cannot directly compare our results with those of these studies because the UK data were older, one study did not report age-specific rates,13 and the other applied different age groupings.14 However, our all-age conservative and optimal CLBRs were generally higher. For example, we calculated a CLBR of 32.7% for the first complete cycle, compared with 28.5–29.5% in the UK; after six complete cycles, the conservative CLBR was 53.9% in Australia and New Zealand, 43.9–46.8% in the UK. These differences may relate to differences in the patient populations, laboratory expertise, or clinical practice. However, as with other studies of ART CLBRs,13-16 and because the Kaplan–Meier method includes only the first event of interest, CLBRs and cycle-specific rates do not account for women who achieve more than one live birth as the result of ART treatment, and are therefore underestimates.
The conservative CLBR is pessimistic in that it assumes that women who discontinue treatment without a live birth have no future prospect of treatment success. Conversely, the optimal CLBR is probably overly optimistic, as it assumes that women who discontinued treatment had the same chance of a live birth with continued treatment as those who did continue. The range between the two provides a reasonable appraisal of the probability of achieving at least one live birth from repeated ART treatment. Our sensitivity analysis accounted for the likely proportion of women who discontinued because the prognosis was poor (doctor censoring), and consistently found that the prognosis-adjusted CLBRs were closer to the optimal than the conservative estimate (online Appendix 1).
A limitation of our study is that our estimates are based on population estimates and do not account for individual prognostic factors that affect a woman’s chance of ART success, including duration of infertility, body mass index, previous childbearing, and ovarian reserve.17 Whether ART treatment should be commenced or continued should ultimately be a decision for the fertility clinician and the patient, taking into account all medical and non-medical factors.
CLBR estimates do not report the probability of a multiple birth. However, given that ART multiple birth rates in Australia and New Zealand are among the lowest in the world (fewer than 5% of all ART births3,4), the safety of ART in the current funding environment in Australia and New Zealand is reassuring. Almost all ART treatment is eligible for partial re-imbursement by Medicare, without limitations on the number of cycles or the woman’s age. The cost of fresh stimulated ART cycles is estimated to be about $10 000, of which $6000–7000 is reimbursed by Medicare.18 Several studies have found that the out-of-pocket cost of ART treatment for patients influences the number of embryos transferred: higher out-of-pockets costs encourage multiple embryo transfers to maximise pregnancy rates with fewer funded cycles.19,20 Australia has one of the most supportive funding arrangements for ART, which partially explains its relatively high utilisation rate,21 as well as its low multiple birth rate. This not only makes Australia one of the safest countries in the world to receive ART treatment, but also reduces the costs arising from multiple gestation births.22 In New Zealand, access to two publicly funded ART cycles is based on meeting specific criteria, including restrictions according to age and body mass index, and only single embryo transfers are permitted,23 resulting in similarly low multiple birth rates, but also more limited access.4
CLBRs based on complete ART cycles are meaningful estimates of the success of ART treatment, reflecting contemporary clinical practice and encouraging safe embryo transfer practices. These estimates can be used when counselling prospective parents about the likelihood of treatment success, as well as for educating the public and informing policy on ART treatments.
Box 1 – A complete assisted reproductive technology cycle, incorporating fresh and frozen/thaw cycles originating from one ovarian stimulation
Box 2 – Demographic and treatment characteristics for women in Australia and New Zealand commencing assisted reproductive technology treatment during 2009–2012 and followed up until 2014 or the first treatment-dependent live birth*
|
Characteristics |
|
||||||||||||||
|
|
|||||||||||||||
|
Total number of women† |
56 652 |
||||||||||||||
|
Number of women achieving first live birth (%) |
30 854 (54.5%) |
||||||||||||||
|
Age at start of first ovarian stimulation cycle (years), median (IQR) |
35 (31–39) |
||||||||||||||
|
Cause of infertility, as diagnosed before the first cycle |
|
||||||||||||||
|
Male factors only |
8093 (14.3%) |
||||||||||||||
|
Female factors only |
17 107 (30.2%) |
||||||||||||||
|
Combined male and female factors |
12 577 (22.2%) |
||||||||||||||
|
Unexplained |
14 175 (25.0%) |
||||||||||||||
|
Not stated |
4700 (8.3%) |
||||||||||||||
|
Total number of initiated single cycles‡ (average number per woman) |
171 967 (3.0) |
||||||||||||||
|
Total number of completed cycles§ (average number per woman) |
120 930 (2.1) |
||||||||||||||
|
Proportion of completed cycles resulting in first live birth |
25.5% |
||||||||||||||
|
Fresh cycles¶ |
|
||||||||||||||
|
Total number of fresh embryo transfer cycles (average number per woman) |
91 233 (1.6) |
||||||||||||||
|
First live births in fresh embryo transfer cycles (% of events) |
20 893 (22.9%) |
||||||||||||||
|
Number of fresh embryos transferred per embryo transfer event |
|
||||||||||||||
|
1 embryo (% of fresh embryo events) |
64 193 (70.4%) |
||||||||||||||
|
= 2 embryos (% of fresh embryo events) |
27 040 (29.6%) |
||||||||||||||
|
Frozen/thaw cycles** |
|
||||||||||||||
|
Total number of thaw embryo transfer cycles (average number per woman) |
47 698 (0.8) |
||||||||||||||
|
First live births in frozen/thaw embryo transfer cycles (% of events) |
9961 (20.9%) |
||||||||||||||
|
Number of frozen/thaw embryos transferred per embryo transfer procedure |
|
||||||||||||||
|
One embryo (% of frozen/thaw embryo transfer events) |
37 801 (79.3%) |
||||||||||||||
|
Two or more embryos (% of frozen/thaw embryo transfer events) |
9898 (20.7%) |
||||||||||||||
|
|
|||||||||||||||
|
* More comprehensive details are included in online Appendix 2. † Number of women who started their first initiated ovarian stimulation cycle treatment during 2009–2012. ‡ Either an initiated ovarian stimulation cycle or an initiated frozen/thaw cycle. § A complete cycle comprises all fresh and frozen/thaw cycles originating from one ovarian stimulation cycle. ¶ A cycle in which a fresh embryo was transferred to a woman’s uterus. Cycles cancelled before transfer are not included. ** A cycle in which a frozen/thaw embryo is transferred to a woman’s uterus. Frozen/thaw cycles cancelled before embryo transfer (eg, a failed thaw) are not included. |
|||||||||||||||
Box 3 – Cycle-specific and cumulative live birth rates for women in Australia and New Zealand commencing assisted reproductive technology (ART) treatment during 2009–2012 and followed until 2014 or the first treatment-dependent live birth*
|
Cycle number |
Number of women starting cycle |
Number of live births |
ART discontinuation rate |
Cycle-specific live birth rate (95% CI) |
Conservative live birth rate (95% CI) |
Optimal live birth rate (95% CI) |
|||||||||
|
|
|||||||||||||||
|
1 |
56 652 |
18 506 |
25.7% |
32.7% (32.2–33.1%) |
32.7% (32.2–33.1%) |
32.7% (32.2–33.1%) |
|||||||||
|
2 |
28 356 |
6940 |
30.2% |
24.5% (23.9–25.1%) |
44.9% (44.5–45.3%) |
49.1% (48.7–49.6%) |
|||||||||
|
3 |
14 942 |
2826 |
31.4% |
18.9% (18.2–19.6%) |
49.9% (49.5–50.3%) |
58.8% (58.3–59.2%) |
|||||||||
|
4 |
8312 |
1269 |
30.5% |
15.3% (14.4–19.6%) |
52.1% (51.7–52.6%) |
65.1% (64.5–65.6%) |
|||||||||
|
5 |
4892 |
614 |
30.6% |
12.6% (11.6–13.4%) |
53.2% (52.8–53.6%) |
69.4% (68.9–70.0%) |
|||||||||
|
6 |
2971 |
360 |
32.1% |
12.1% (10.9–13.4%) |
53.9% (53.5–54.3%) |
73.1% (72.5–73.7%) |
|||||||||
|
7 |
1772 |
158 |
31.9% |
8.9% (7.6–10.4%) |
54.1% (53.7–54.6%) |
75.5% (74.9–76.2%) |
|||||||||
|
8 |
1099 |
76 |
32.7% |
6.9% (5.5–8.7%) |
54.3% (53.9–54.7%) |
77.2% (76.5–77.9%) |
|||||||||
|
|
|||||||||||||||
|
* Full details according to individual age groups are included in online Appendix 3. |
|||||||||||||||
Received 16 December 2016, accepted 7 March 2017
- Georgina M Chambers1
- Repon C Paul1
- Katie Harris1
- Oisin Fitzgerald1
- Clare V Boothroyd2
- Luk Rombauts3
- Michael G Chapman4
- Louisa Jorm5
- 1 National Perinatal Epidemiology and Statistics Unit, Centre for Big Data Research in Health and School of Women's and Children's Health, University of New South Wales, Sydney, NSW
- 2 Care Fertility, Brisbane, QLD
- 3 Monash IVF, Melbourne, VIC
- 4 IVF Australia Southern Sydney, Sydney, NSW
- 5 Centre for Big Data Research in Health, University of New South Wales, Sydney, NSW
The Fertility Society of Australia funds the Australian and New Zealand Assisted Reproductive Database (ANZARD). We acknowledge the provision of data to ANZARD by Australian and New Zealand fertility clinics.
The Fertility Society of Australia funds the National Perinatal Epidemiology and Statistics Unit to manage ANZARD and conduct national reporting of ART in Australia and New Zealand. Georgina Chambers is employed by the University of New South Wales (UNSW) and is director of the National Perinatal Epidemiology and Statistics Unit at UNSW. She has received an institutional research grant unrelated to this study from the Australian Research Council for which Virtus Health, a publicly listed IVF company, was the partner organisation (2010–2013). Clare Boothroyd owns a facility that offers ART, and has received funding from MSD, Merck-Serono, and Ferring for work unrelated to this article. Luk Rombauts has a minority shareholding in the Monash IVF Group, a publicly listed IVF company, and has received funding from MSD, Merck-Serono, and Ferring for work unrelated to this article. Michael Chapman has a minority shareholding in Virtus Health, and has received funding from MSD, Merck-Serono, and Ferring for work unrelated to this article.
- 1. Inhorn MC, Patrizio P. Infertility around the globe: new thinking on gender, reproductive technologies and global movements in the 21st century. Hum Reprod Update 2015; 21: 411-426.
- 2. Herbert DL, Lucke JC, Dobson AJ. Infertility, medical advice and treatment with fertility hormones and/or in vitro fertilisation: a population perspective from the Australian Longitudinal Study on Women’s Health. Aust N Z J Public Health 2009; 33: 358-364.
- 3. Dyer S, Chambers GM, de Mouzon J, et al. International Committee for Monitoring Assisted Reproductive Technologies world report: assisted reproductive technology 2008, 2009 and 2010. Hum Reprod 2016; 31: 1588-1609.
- 4. Harris K, Fitzgerald O, Paul R, et al. Assisted reproduction technology in Australia and New Zealand 2014. Sydney: National Perinatal Epidemiology and Statistics Unit, University of New South Wales, 2016. https://npesu.unsw.edu.au/sites/default/files/npesu/data_collection/Assisted%20reproductive%20technology%20in%20Australia%20and%20New%20Zealand%202014_0.pdf (accessed May 2017).
- 5. Centers for Disease Control and Prevention, American Society for Reproductive Medicine, Society for Assisted Reproductive Technology. 2013 Assisted reproductive technology fertility clinic success rates report. Atlanta: US Department of Health and Human Services, 2015. https://www.cdc.gov/art/pdf/2013-report/art-2013-fertility-clinic-report.pdf (accessed May 2017).
- 6. Kupka MS, D’Hooghe T, Ferraretti AP, et al. Assisted reproductive technology in Europe, 2011: results generated from European registers by ESHRE. Hum Reprod 2016; 31: 1638-1652.
- 7. Chambers GM, Wand H, Macaldowie A, et al. Population trends and live birth rates associated with common ART treatment strategies. Hum Reprod 2016; 31: 2632-2641.
- 8. The Practice Committee of the American Society for Reproductive Medicine. Multiple pregnancy associated with infertility therapy. Fertil Steril 2006; 86 (5 Suppl 1): S106-S110.
- 9. Cutting R, Morroll D, Roberts SA, et al. Elective single embryo transfer: guidelines for practice British Fertility Society and Association of Clinical Embryologists. Hum Fertil 2008; 11: 131-146.
- 10. Maheshwari A, McLernon D, Bhattacharya S. Cumulative live birth rate: time for a consensus? Hum Reprod 2015; 30: 2703-2707.
- 11. Moragianni VA, Penzias AS. Cumulative live-birth rates after assisted reproductive technology. Curr Opin Obstet Gynecol 2010; 22: 189-192.
- 12. Gameiro S, Boivin J, Peronace L, et al. Why do patients discontinue fertility treatment? A systematic review of reasons and predictors of discontinuation in fertility treatment. Hum Reprod Update 2012; 18: 652-669.
- 13. McLernon DJ, Maheshwari A, Lee AJ, Bhattacharya S. Cumulative live birth rates after one or more complete cycles of IVF: a population-based study of linked cycle data from 178 898 women. Hum Reprod 2016; 31: 572-581.
- 14. Smith AC, Tilling K, Nelson SM, et al. Live-birth rate associated with repeat in vitro fertilization treatment cycles. JAMA 2015; 314: 2654-2662.
- 15. Malizia BA, Hacker MR, Penzias AS. Cumulative live-birth rates after in vitro fertilization. N Engl J Med 2009; 360: 236-243.
- 16. Stern JE, Brown MB, Luke B, et al. Calculating cumulative live-birth rates from linked cycles of assisted reproductive technology (ART): data from the Massachusetts SART CORS. Fertil Steril 2010; 94: 1334-1340.
- 17. van Loendersloot LL, van Wely M, Limpens J, et al. Predictive factors in in vitro fertilization (IVF): a systematic review and meta-analysis. Hum Reprod Update 2010; 16: 577-589.
- 18. Chambers GM, Zhu R, Hoang V, et al. A reduction in public funding for fertility treatment: an econometric analysis of access to treatment and savings to government. BMC Health Serv Res 2012; 12: 142.
- 19. Chambers GM, Hoang VP, Sullivan EA, et al. The impact of consumer affordability on access to assisted reproductive technologies and embryo transfer practices: an international analysis. Fertil Steril 2014; 101: 191-198.e4.
- 20. Hamilton BH, McManus B. The effects of insurance mandates on choices and outcomes in infertility treatment markets. Health Econ 2012; 21: 994-1016.
- 21. Chambers GM, Sullivan EA, Ishihara O, et al. The economic impact of assisted reproductive technology: a review of selected developed countries. Fertil Steril 2009; 91: 2281-2294.
- 22. Chambers GM, Illingworth PJ, Sullivan EA. Assisted reproductive technology: public funding and the voluntary shift to single embryo transfer in Australia. Med J Aust 2011; 195: 594-598. <MJA full text>
- 23. Farquhar CM, Wang YA, Sullivan EA. A comparative analysis of assisted reproductive technology cycles in Australia and New Zealand 2004–2007. Hum Reprod 2010; 25: 2281-2289.
Abstract
Objectives: To estimate cumulative live birth rates (CLBRs) following repeated assisted reproductive technology (ART) ovarian stimulation cycles, including all fresh and frozen/thaw embryo transfers (complete cycles).
Design, setting and participants: Prospective follow-up of 56 652 women commencing ART in Australian and New Zealand during 2009–2012, and followed until 2014 or the first treatment-dependent live birth.
Main outcome measures: CLBRs and cycle-specific live birth rates were calculated for up to eight cycles, stratified by the age of the women (< 30, 30–34, 35–39, 40–44, > 44 years). Conservative CLBRs assumed that women discontinuing treatment had no chance of achieving a live birth if had they continued treatment; optimal CLBRs assumed that they would have had the same chance as women who continued treatment.
Results: The overall CLBR was 32.7% (95% CI, 32.2–33.1%) in the first cycle, rising by the eighth cycle to 54.3% (95% CI, 53.9–54.7%) (conservative) and 77.2% (95% CI, 76.5–77.9%) (optimal). The CLBR decreased with age and number of complete cycles. For women who commenced ART treatment before 30 years of age, the CLBR for the first complete cycle was 43.7% (95% CI, 42.6–44.7%), rising to 69.2% (95% CI, 68.2–70.1%) (conservative) and 92.8% (95% CI, 91.6–94.0) (optimal) for the seventh cycle. For women aged 40–44 years, the CLBR was 10.7% (95% CI, 10.1–11.3%) for the first complete cycle, rising to 21.0% (95% CI, 20.2–21.8%) (conservative) and 37.9% (95% CI, 35.9–39.9%) (optimal) for the eighth cycle.
Conclusion: CLBRs based on complete cycles are meaningful estimates of ART success, reflecting contemporary clinical practice and encouraging safe practice. These estimates can be used when counselling patients and to inform public policy on ART treatment.