


The known Pathology testing rates are increasing in Australia. Most pathology test ordering is initiated in general practice. Concerns about inappropriate pathology test ordering, including in general practice, have been expressed.
The new Contrary to expectations that experience in the general practice environment of high prevalence of undifferentiated illness and low prevalence of serious illness would reduce test ordering, the number of tests requested by general practice registrars increased by 11% per training term.
The implications Test ordering (and, potentially, overordering) may peak during late vocational training and early career practice. Registrars need support through this difficult period in the development of their clinical practice patterns.
Pathology testing is an integral part of clinical practice, for screening, diagnosing and monitoring disease. Clinicians have access to an ever expanding selection of pathology tests, and the volume of ordering has grown markedly in recent years.1,2 The increasing range reflects technological advances and increased understanding of disease processes, and this may underpin an appropriate expansion of test ordering. But inappropriate ordering is a major concern in contemporary health care;1,3-5 not only does it increase the costs of care,6 it can also lead to overdiagnosis and overtreatment.7,8
General practice generates a greater proportion of pathology tests than other specialities and disciplines; in Canada, for example, 58% of total pathology expenditure was generated by primary care physicians.9 Inappropriate pathology testing is a particular problem in general practice.2,10 Compared with other areas of medical practice, the prevalence of definable disease is lower and that of undifferentiated disease correspondingly greater, with consequently lower pre-test probabilities of disease; this reduces the positive predictive value of individual tests and increases the proportion of false-positive test results. This, in turn, leads to overdiagnosis and inappropriate additional testing.8 Further, even true-positive results can be problematic if the findings prove to be incidental,8 or if the evidence for the treatment of the diagnosed condition is unclear.11 Overtreatment, with attendant waste of limited health care resources and exposure of patients to iatrogenic harm (including psychological harm), may ensue.8
Australian data indicate that general practitioners often do not adhere to evidence-based consensus guidelines when ordering pathology tests.2 In Canada, GPs are also much more likely than specialist physicians to order non-evidence-based testing at periodic health examinations.10 Differences in testing rates between countries,12 regions,6,13 individual general practices,14 and individual GPs10,13 are marked, and seem to be more attributable to practitioner preferences than to demographic or other factors.10,15
Early career GPs and GPs-in-training are of particular interest in this respect, as they are at a career stage in which they establish patterns of clinical behaviour that may be long lasting. They have moved from a hospital environment with a high prevalence of serious illness to one of low prevalence. They often have difficulty tolerating diagnostic uncertainty and selecting investigations for undifferentiated disease.16 It is therefore unsurprising that Australian general practice registrars order more tests than more established colleagues,17 especially given that registrars have the same test ordering rights as senior GPs.
Time and experience in a general practice environment might be expected to attenuate the volume of test requests by general practice registrars. To test whether this is the case, we analysed longitudinal data on their test ordering behaviour in Australia.
Methods
We conducted a longitudinal analysis of ten rounds of data collection (2010–2014) for the Registrar Clinical Encounters in Training (ReCEnT) study. ReCEnT is an ongoing, multicentre, cohort study of general practice registrars from five of 17 regional training providers (RTPs), from all Australian states except Western Australia.
ReCEnT documents the clinical experiences of general practice registrars, including pathology test ordering; its methodology has been described previously.18 Briefly, registrars record on paper forms the details of 60 consecutive consultations during the midpoint of each of their three compulsory general practice training terms (ie, every 6 months for full-time registrars, every 12 months for part-time registrars). Some registrars at one of the five RTPs (RTP 1) also recorded data during an optional fourth training term. Only office-based consultations, not home visits or nursing home visits, are recorded. As data collection is intended to reflect a normal week of general practice, consultations in a specialised clinic (eg, vaccination clinic) are excluded. Registrar and practice demographic characteristics for each collection period (training term) are also documented. Data collection and reflection about feedback reports on their individual results are integral to the registrar education program, and registrars may also consent to their data being used for research purposes.
Analyses
Each RTP contributed two to ten rounds of data collection, depending on when they started participating in ReCEnT.
The outcome variable was the number of pathology tests ordered per consultation. Registrars record all pathology tests ordered in each consultation, to a maximum of 12 individual tests; if more than 12 are ordered, participants are asked to record the 12 most clinically relevant. The main independent variable of interest was our measure of time for this analysis, the registrar training term (Terms 1–4).
Other covariates included:
-
registrar variables: age, sex, full-time or part-time status, country of primary medical training (Australia v other).
-
patient variables: age, sex, Indigenous status, non-English-speaking background status, the patient being new to the practice, the patient being new to the registrar.
-
practice variables: Australian Standard Geographical Classification–Remoteness Area (ASGC-RA) classification19 (major city, inner regional, outer regional, remote, very remote) and socio-economic status (Socio-Economic Indexes for Areas [SEIFA] Index of Relative Socio-economic Disadvantage decile20 of the postcode of the practice), billing policy (bulk-billing v no bulk-billing).
-
consultation variables: duration of the consultation, whether imaging tests were ordered, the number of problems managed, whether a chronic disease was managed in the consultation. Problems and diagnoses were coded according to the International Classification of Primary Care, version 2 (ICPC-2);21 whether a diagnosis or problem was a chronic disease was coded according to a classification derived from the ICPC-2.22 We also recorded whether the registrar sought in-consultation advice or information from their supervisor or other sources, including specialists, books or electronic resources.
Statistical analysis
The outcome was a count variable with 13 response levels (0–12 tests ordered). A negative binomial model was fitted in SAS 9.4 (SAS Institute) to account for overdispersion in the outcome distribution. In a second analysis (for comparison with the negative binomial model), a zero-inflated negative binomial model was fitted in Stata 13.1 (StataCorp). In addition to allowing for overdispersion, this analysis also models variables with large numbers of zero counts. The assumption is that excess zero counts are generated by a process distinct from that which generates non-zero values, yielding two distributions that are modelled independently. These models produce two sets of parameter estimates: one set of estimates for the count outcome, and one set for predicting membership in the “certain zero” category. Parameter estimation was performed within the generalised estimating equations (GEE) framework to account for repeated measures on registrars.
In order to assess potential temporal changes in the number of tests ordered, a time variable was included (training term). Variables were selected for inclusion in the multivariable model by modelling each covariate, adjusted for time, to test for a univariate association with the outcome. Covariates for which P < 0.20 and with a non-negligible effect size (ie, not close to 0) in the univariate analysis were considered for inclusion in the final multivariable model. Covariates which had a small effect size and were no longer significant (P > 0.05) in the multivariable model were tested for removal from the model; if removal did not cause a change in effect size greater than 10% or a change in statistical significance, the covariate was removed from the final model.
The GEEs accounted for the repeated measures on registrars, but sensitivity analyses tested for the following types of clustering:
-
clustering by registrar only;
-
clustering by registrar nested within practice; and
-
clustering by registrar nested within term.
The results of these analyses were compared with the primary model to assess their impact on conclusions based on the primary model.
Ethics approval
Ethics approval was granted by the Human Research Ethics Committee of the University of Newcastle (reference, H-2009-0323).
Results
A total of 876 registrars (response rate [ie, proportion who consented to their data being used for research purposes], 96.4%) contributed 2017 registrar–rounds of data, including the details for 114 584 individual consultations. The demographic characteristics of the participating registrars and practices are presented in Box 1; the most frequently ordered tests are listed in Box 2.
No pathology tests were ordered in 87 885 consultations (77%); at least one was ordered in 26 699 consultations (23%; Box 3). The associations between individual practitioner, practice and patient characteristics and the number of tests ordered (adjusted for time) are included in the online Appendix, table 1.
Nesting by registrar within practice and registrar within term did not cause any substantial changes from clustering by registrar alone. The effect size for each covariate varied between the different models by less than 2% (data not shown). It was concluded that clustering by registrar within the time covariate (registrar term) was adequate for the final multivariable model.
In the negative binomial model, the number of pathology tests ordered by registrars increased significantly with time, by 11% for each additional training term (95% confidence interval [CI], 8–15%; P < 0.001). The covariates “registrar full-time or part-time status”, “registrar sex” and “country of primary medical qualifications” had small effect sizes and were no longer significant in the model, and were removed from the multivariable model; as this did not substantively alter it, these covariates were not included in the final model (Box 4, Box 5). In the zero-inflated negative binomial analysis, the effect of time was smaller but still significant, with an estimated increase in the number of pathology tests ordered by registrars per training term of 4% (95% CI, 1–7%; P = 0.016; (Appendix, table 2).
Discussion
Time and experience in the typical general practice environment of relatively low prevalence of serious disease (compared with the hospital environment) had been expected to attenuate the rate of test ordering during general practice registrar training. It might also be expected that specific training in rational test ordering would have been included in GP vocational training, and thereby also reduced ordering rates. Contrary to our expectations, however, general practice registrars ordered more pathology tests as their time in training increased. Given their costs and the implications for patient wellbeing and safety, the 11% increase in ordering for each additional training term was highly significant in clinical as well as in statistical terms. The smaller increase (4% per term) found in our secondary, zero-inflated negative binomial analysis was also highly clinically significant.
Our finding that ordering increased as registrars moved through training appears to conflict with evidence that general practice registrars in Australia order more tests than established GPs.17,23 One relevant factor is the degree of autonomy or responsibility of the registrar in Australia. Although they are vocational trainees, general practice registrars have a large degree of clinical independence, including when ordering tests. They have recourse to advice from clinical supervisors (in an apprenticeship-like model), but this assistance decreases markedly with each training term.24 In our analysis (as in a previous cross-sectional analysis of this population17), seeking information (including supervisor advice) was associated with lower levels of test ordering. It is possible that the uncertainty inherent to increasingly independent decision making by more senior registrars (ie, with less supervisor assistance) leads to more ordering, so that the relationship of rational test ordering (ie, targeted, evidence-based ordering) with career stage may exhibit a J-shaped curve, with a peak in overall ordering during late vocational training and early post-vocational training practice before again declining with greater experience.
More experienced registrars may treat patients with more complex disease, especially more complex chronic disease, and this might be associated with an appropriate increase in the ordering of tests. Earlier analyses of ReCEnT data suggest, however, that this is not the case.25,26 Similarly, more experienced registrars may adhere more closely to clinical guidelines and protocols, but the guidelines are as likely to recommend parsimony in pathology testing as to prompt appropriate ordering of tests.
Strengths and limitations of our study
Our longitudinal approach allowed us to assess temporal changes in test ordering during training. The large number of registrars who delivered detailed contemporaneous records of individual clinical consultations provided us with fine-grained data with which we could adjust our analyses for several demographic, clinical and educational variables. The study population drawn from five of 17 regional vocational training providers in different geographic settings across five of six states increases the potential generalisability of our results to other Australian registrars, and the participation rate was higher than for other studies of GPs.27
The principal limitation of our study was that we did not have data on the appropriateness of individual test ordering decisions. Tests were ordered in 23% of consultations, and in 10% of consultations only one was ordered; of these, at least some (for example, Pap smears) will have been appropriate. We interpreted our findings, however, in the light of the volume of literature describing a high prevalence of inappropriate testing.5,10,15
A further limitation is that registrars recorded a maximum of 12 individual pathology tests ordered per consultation (ie, we may have underestimated the number of requested tests); but, as this maximum was recorded for only 1.4% of consultations, this will not have had a large effect on our results.
Implications for practice and policy
An 11% increase in test ordering per term of training has implications for health care costs.6 It may also have implications for patient wellbeing and safety if, as seems likely, higher pathology testing rates entail increased inappropriate testing, elevating the probability of overdiagnosis and overtreatment.1,4,5,8 Even were the effect to decline as early career GPs gained experience and became more comfortable with diagnostic uncertainty, its impact would persist for a considerable period.
Targeted, multifaceted interventions that encourage rational test ordering should incorporate several components. It would be appropriate to better support registrars during this difficult period in their clinical development. Educational interventions in other settings have been effective in reducing test ordering by changing the practice system or environment, to encourage behavioural change in clinicians.28 Specific approaches could include developing and applying clinical practice guidelines that modify the behaviour of clinicians and patients and the organisation of health care processes.3 Effective interventions in primary care have included guideline dissemination and education,29,30 modifying laboratory request forms,29 small group quality improvement meetings,30 and feedback on test request rates.30 Educating GPs about estimating the pre-test probability of disease when considering a test, and on how to respond to patient expectations,31 may also be useful. As seeking in-consultation information or advice is associated with lower rates of ordering, structural changes to the supervisory model, including support for greater supervisor in-consultation advice during later training terms, may be indicated.
Conclusion
We found that test ordering by general practice registrars increased during vocational training. While the lack of information about the appropriateness of individual tests restricts the interpretation of this finding, the increase causes concerns about overtesting. Registrars need to be supported during a difficult period in the development of their clinical practice patterns.
Box 1 – Characteristics of the participating registrars and practices
|
|
|||||||||||||||
|
Registrar variables (N = 876) |
|||||||||||||||
|
Sex |
|
||||||||||||||
|
Men |
295 (33.7%) |
||||||||||||||
|
Women |
581 (66.3%) |
||||||||||||||
|
Enrolment pathway† |
|
||||||||||||||
|
General |
656 (74.9%) |
||||||||||||||
|
Rural |
217 (24.8%) |
||||||||||||||
|
Country of primary medical training† |
|
||||||||||||||
|
Australia |
183 (20.9%) |
||||||||||||||
|
Elsewhere |
683 (78.0%) |
||||||||||||||
|
Registrar–term and –practice variables (N = 2017) |
|||||||||||||||
|
Registrar training term |
|
||||||||||||||
|
Term 1 |
783 (38.8%) |
||||||||||||||
|
Term 2 |
682 (33.8%) |
||||||||||||||
|
Term 3 |
477 (23.6%) |
||||||||||||||
|
Term 4 |
75 (3.7%) |
||||||||||||||
|
Registrar age (years), mean (SD) |
32.8 (6.5) |
||||||||||||||
|
Full-time work† |
|
||||||||||||||
|
No |
433 (21.5%) |
||||||||||||||
|
Yes |
1539 (76.3%) |
||||||||||||||
|
Practice routinely bulk-bills† |
|
||||||||||||||
|
No |
1650 (81.8%) |
||||||||||||||
|
Yes |
352 (17.5%) |
||||||||||||||
|
Number of GPs working at the practice† |
|
||||||||||||||
|
1–5 (small practice) |
663 (32.9%) |
||||||||||||||
|
≥ 6 (large practice) |
1304 (64.7%) |
||||||||||||||
|
Geographic classification |
|
||||||||||||||
|
Major city |
1169 (58.0%) |
||||||||||||||
|
Inner regional |
553 (27.4%) |
||||||||||||||
|
Outer regional, remote or very remote |
295 (14.6%) |
||||||||||||||
|
IRSD (decile), mean (SD) |
5.5 (2.9) |
||||||||||||||
|
|
|||||||||||||||
|
* IRSD = Socio-Economic Indexes for Areas (SEIFA) Index of Relative Socio-economic Disadvantage; 1 = most disadvantaged, 10 = least disadvantaged. † Numbers do not add to totals because of missing data. |
|||||||||||||||
Box 2 – The ten most frequently ordered pathology tests
|
Pathology test |
Number of tests ordered (per 100 encounters) |
||||||||||||||
|
Total |
Term 1 |
Term 2 |
Term 3 |
Term 4 |
|||||||||||
|
|
|||||||||||||||
|
Full blood count |
14 206 (12.4) |
6089 (13.2) |
4222 (11.6) |
3451 (12.4) |
444 (9.9) |
||||||||||
|
Urea/electrolytes/creatinine |
12 068 (10.5) |
5116 (11.1) |
3525 (9.72) |
3047 (10.9) |
380 (8.5) |
||||||||||
|
Liver function |
10 468 (9.14) |
4362 (9.49) |
3132 (8.64) |
2635 (9.44) |
339 (7.6) |
||||||||||
|
Thyroid function |
6990 (6.10) |
2971 (6.47) |
2091 (5.77) |
1722 (6.17) |
206 (4.6) |
||||||||||
|
Lipids/cholesterol/triglycerides |
6687 (5.84) |
2884 (6.28) |
1954 (5.39) |
1649 (5.91) |
200 (4.5) |
||||||||||
|
Glucose |
5885 (5.14) |
2492 (5.42) |
1688 (4.66) |
1519 (5.44) |
186 (4.1) |
||||||||||
|
Urine for microscopy, culture and sensitivities |
5254 (4.59) |
2211 (4.81) |
1600 (4.41) |
1303 (4.67) |
140 (3.1) |
||||||||||
|
Iron studies |
4295 (3.75) |
1777 (3.87) |
1289 (3.56) |
1099 (3.94) |
130 (2.9) |
||||||||||
|
Pap smear cytology |
3851 (3.61) |
1635 (3.56) |
1180 (3.25) |
936 (3.35) |
99 (2.2) |
||||||||||
|
C-reactive protein |
3239 (2.83) |
1333 (2.90) |
996 (2.75) |
820 (2.94) |
90 (2.0) |
||||||||||
|
|
|||||||||||||||
|
|
|||||||||||||||
Box 3 – The number of pathology tests ordered per consultation
|
Number of tests |
Consultations* |
||||||||||||||
|
|
|||||||||||||||
|
0 |
87 885 (76.7%) |
||||||||||||||
|
1 |
11 663 (10.2%) |
||||||||||||||
|
2 |
2716 (2.4%) |
||||||||||||||
|
3 |
1953 (1.7%) |
||||||||||||||
|
4 |
1936 (1.7%) |
||||||||||||||
|
5 |
2236 (2.0%) |
||||||||||||||
|
6 |
1847 (1.6%) |
||||||||||||||
|
7 |
1102 (1.0%) |
||||||||||||||
|
8 |
680 (0.6%) |
||||||||||||||
|
9 |
483 (0.4%) |
||||||||||||||
|
10 |
325 (0.3%) |
||||||||||||||
|
11 |
181 (0.2%) |
||||||||||||||
|
12 (maximum) |
1577 (1.4%) |
||||||||||||||
|
|
|||||||||||||||
|
* Total number of consultations: 114 584. |
|||||||||||||||
Box 4 – Simple and multiple negative binomial regression analyses of associations of practitioner, practice and patient characteristics with number of pathology tests ordered*
|
Variable |
Univariate |
Adjusted† |
|||||||||||||
|
IRR (95% CI) |
P |
IRR (95% CI) |
P |
||||||||||||
|
|
|||||||||||||||
|
Time (training term) |
0.97 (0.94–0.99) |
0.005 |
1.11 (1.08–1.15) |
< 0.001 |
|||||||||||
|
Patient age group (years) |
|
|
|
|
|||||||||||
|
0–14 |
0.20 (0.19–0.21) |
< 0.001 |
0.29 (0.26–0.31) |
< 0.001 |
|||||||||||
|
15–34 |
1 |
— |
1 |
— |
|||||||||||
|
35–64 |
1.00 (0.96–1.04) |
0.94 |
0.96 (0.92–1.00) |
0.030 |
|||||||||||
|
≥ 65 |
0.80 (0.76–0.85) |
< 0.001 |
0.80 (0.75–0.85) |
< 0.001 |
|||||||||||
|
Patient sex (female) |
1.32 (1.27–1.37) |
< 0.001 |
1.21 (1.17–1.26) |
< 0.001 |
|||||||||||
|
Non-English-speaking background |
1.20 (1.12–1.28) |
< 0.001 |
1.10 (1.02–1.20) |
0.016 |
|||||||||||
|
Patient/practice relationship |
|||||||||||||||
|
Existing patient |
1 |
— |
1 |
— |
|||||||||||
|
New to registrar |
1.18 (1.14–1.23) |
< 0.001 |
1.37 (1.31–1.43) |
< 0.001 |
|||||||||||
|
New to practice |
1.71 (1.60–1.82) |
< 0.001 |
1.59 (1.47–1.72) |
< 0.001 |
|||||||||||
|
Practice routinely bulk-bills |
1.06 (1.00–1.13) |
0.07 |
0.91 (0.85–0.97) |
0.005 |
|||||||||||
|
Regional training provider (RTP) |
|||||||||||||||
|
RTP 1 |
1 |
— |
1 |
— |
|||||||||||
|
RTP 2 |
0.95 (0.87–1.05) |
0.31 |
0.99 (0.91–1.08) |
0.90 |
|||||||||||
|
RTP 3 |
0.83 (0.75–0.91) |
< 0.001 |
0.86 (0.79–0.95) |
0.002 |
|||||||||||
|
RTP 4 |
0.92 (0.86–0.98) |
0.015 |
0.93 (0.88–0.99) |
0.034 |
|||||||||||
|
RTP 5 |
1.11 (0.78–1.58) |
0.55 |
1.07 (0.82–1.39) |
0.63 |
|||||||||||
|
Sought assistance‡ |
1.19 (1.14–1.24) |
< 0.001 |
0.93 (0.88–0.98) |
0.004 |
|||||||||||
|
Imaging ordered |
2.05 (1.97–2.13) |
< 0.001 |
1.44 (1.36–1.51) |
< 0.001 |
|||||||||||
|
Follow-up ordered |
3.55 (3.36–3.75) |
< 0.001 |
2.89 (2.73–3.05) |
< 0.001 |
|||||||||||
|
Learning goals generated§ |
1.74 (1.68–1.81) |
< 0.001 |
1.34 (1.28–1.40) |
< 0.001 |
|||||||||||
|
Chronic disease |
1.47 (1.42–1.53) |
< 0.001 |
0.94 (0.90–0.99) |
0.010 |
|||||||||||
|
Consultation duration |
1.07 (1.06–1.07) |
< 0.001 |
1.03 (1.03–1.04) |
< 0.001 |
|||||||||||
|
Number of problems |
1.81 (1.77–1.84) |
< 0.001 |
1.53 (1.50–1.57) |
< 0.001 |
|||||||||||
|
|
|||||||||||||||
|
IRR = incidence rate ratio. * The registrar covariates “full-time v part-time status”, “sex” and “country of primary medical qualifications” were not included in the final model (see text). † Adjusted for all variables in the first column. ‡ Practitioner sought in-consultation information or assistance, including from a supervisor, specialist, book, electronic resource. § Generated a topic to be reviewed or researched after the consultation. |
|||||||||||||||
Box 5 – Least squares mean estimates of number of pathology tests ordered per consultation, by registrar term*
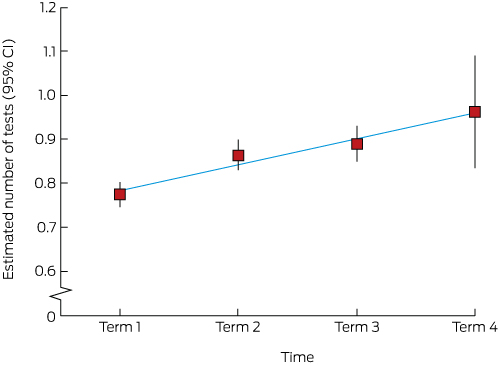
* Modelled as the logarithm of the count, with least squares mean estimates (and 95% confidence interval endpoints) exponentiated for plotting on the original count scale, by term. The numbers of registrars for each term were 783, 682, 477 and 75 respectively; the total number of tests were 50 287, 35 253, 29 419 and 3495 respectively.
Received 13 December 2016, accepted 21 April 2017
- Parker J Magin1,2
- Amanda Tapley1,2
- Simon Morgan3
- Kim Henderson1,2
- Elizabeth G Holliday1,4
- Andrew R Davey1,2
- Jean Ball4
- Nigel F Catzikiris2
- Katie J Mulquiney1,2
- Mieke L van Driel5
- 1 University of Newcastle, Newcastle, NSW
- 2 GP Synergy, Sydney, NSW
- 3 Elermore Vale General Practice, Newcastle, NSW
- 4 Hunter Medical Research Institute, Newcastle, NSW
- 5 University of Queensland, Brisbane, QLD
This work was supported by an Education Research Grant from the Australian Department of Health (grant number, D14/17024). The ReCEnT project was funded until 2015 by the participating educational organisations: General Practice Training Valley to Coast, the Victorian Metropolitan Alliance, General Practice Training Tasmania, Adelaide to Outback GP Training Program, and Tropical Medical Training, all of which were funded by the Australian Government. From 2016, ReCEnT is funded by an Australian Department of Health commissioned research grant and supported by the GP Synergy Regional Training Organisation. We acknowledge the general practice registrars, general practice supervisors and practices who have participated in the ReCEnT project, and Neil Spike and Rohan Kerr for their contributions to the wider ReCEnT project.
No relevant disclosures.
- 1. Winkens R, Dinant G-J. Evidence base of clinical diagnosis: rational, cost effective use of investigations in clinical practice. BMJ 2002; 324: 783.
- 2. Bayram C, Britt H, Miller G, Valenti L. Evidence–practice gap in GP pathology test ordering: a comparison of BEACH pathology data and recommended testing. Sydney: University of Sydney, 2009. https://www.health.gov.au/internet/main/publishing.nsf/Content/9C300FE48F876E95CA257BF0001ACE0E/$File/Evidence-practice%20gap%20in%20GP%20pathology%20test%20ordering.pdf (accessed May 2017).
- 3. Alonso-Cerezo MC, Martin JS, Garcia Montes MA, de la Iglesia VM. Appropriate utilization of clinical laboratory tests. Clin Chem Lab Med 2009; 47: 1461-1465.
- 4. Hammett RJH, Harris RD. Halting the growth in diagnostic testing. Med J Aust 2002; 177: 124-125. <MJA full text>
- 5. Zhi M, Ding EL, Theisen-Toupal J, et al. The landscape of inappropriate laboratory testing: a 15-year meta-analysis. PLoS One 2013; 8: e78962.
- 6. Mindemark M, Wernroth L, Larsson A. Costly regional variations in primary health care test utilization in Sweden. Scand J Clin Lab Invest 2010; 70: 164-170.
- 7. Barth JH, Jones RG. Indiscriminate investigations have adverse effects. BMJ 2003; 326: 393.
- 8. Deyo RA. Cascade effects of medical technology. Annu Rev Public Health 2002; 23: 23-44.
- 9. Naugler C, Thomas R, Turin TC, et al. Yearly clinical laboratory test expenditures for different medical specialties in a major Canadian city. Am J Clin Pathol 2015; 144: 97-102.
- 10. van Walraven C, Goel V, Austin P. Why are investigations not recommended by practice guidelines ordered at the periodic health examination? J Eval Clin Pract 2000; 6: 215-224.
- 11. Ilic D, O’Connor D, Green S, Wilt TJ. Screening for prostate cancer: an updated Cochrane systematic review. BJU Int 2011; 107: 882-891.
- 12. Leurquin P, Van Casteren V, De Maeseneer J. Use of blood tests in general practice: a collaborative study in eight European countries. Eurosentinel Study Group. Br J Gen Pract 1995; 45: 21-25.
- 13. Verstappen WHJM, ter Riet G, Dubois WI, et al. Variation in test ordering behaviour of GPs: professional or context-related factors? Fam Pract 2004; 21: 387-395.
- 14. Smellie WS, Galloway MJ, Chinn D. Benchmarking general practice use of pathology services: a model for monitoring change. J Clin Pathol 2000; 53: 476-480.
- 15. Smellie WSA, Galloway MJ, Chinn D, Gedling P. Is clinical practice variability the major reason for differences in pathology requesting patterns in general practice? J Clin Pathol 2002; 55: 312-314.
- 16. Bubner T, Laurence C, Tirimacco R. Assessing pathology training needs — results from a survey of general practice registrars. Aust Fam Physician 2012; 41: 721-724.
- 17. Morgan S, Henderson KM, Tapley A, et al. Pathology test-ordering behaviour of Australian general practice trainees: a cross-sectional analysis. Int J Qual Health Care 2015; 27: 528-535.
- 18. Morgan S, Magin PJ, Henderson KM, et al. Study protocol: the Registrar Clinical Encounters in Training (ReCEnT) study. BMC Fam Pract 2012; 13: 50.
- 19. Trewin D. Statistical geography volume 1: Australian Standard Geographical Classification (ASGC). July 2006 (ABS Cat. No. 1216.0). Canberra: ABS, 2006. http://www.ausstats.abs.gov.au/ausstats/subscriber.nsf/0/3E15ACB95DA01A65CA2571AA0018369F/$File/12160_2006.pdf (accessed May 2017).
- 20. Pink B. An introduction to Socio-Economic Indexes for Areas (SEIFA). 2006 (ABS Cat. No. 2039.0). Canberra: Australian Bureau of Statistics, 2008. http://www.ausstats.abs.gov.au/ausstats/subscriber.nsf/0/D729075E079F9FDECA2574170011B088/$File/20390_2006.pdf (accessed May 2017).
- 21. Classification Committee of the World Organization of Family Doctors (WONCA). ICPC-2. International Classification of Primary Care, 2nd ed. Oxford: Oxford University Press, 1998.
- 22. O’Halloran J, Miller GC, Britt H. Defining chronic conditions for primary care with ICPC-2. Fam Pract 2004; 21: 381-386.
- 23. Britt H, Miller G, Henderson J, et al. General practice activity in Australia 2013–14 (General Practice Series No. 36). Sydney: Sydney University Press, 2014. https://ses.library.usyd.edu.au/bitstream/2123/11882/4/9781743324226_ONLINE.pdf (accessed May 2017).
- 24. Magin P, Morgan S, Wearne S, et al. GP trainees’ in-consultation information-seeking: associations with human, paper and electronic sources. Fam Pract 2015; 32: 525-532.
- 25. Bonney A, Morgan S, Tapley A, et al. Older patients’ consultations in an apprenticeship model-based general practice training program: a cross-sectional study. Australas J Ageing 2017; 36: E1-E7.
- 26. Pearlman J, Morgan S, van Driel M, et al. Continuity of care in general practice vocational training: prevalence, associations and implications for training. Educ Primary Care 2016; 27: 27-36.
- 27. Bonevski B, Magin P, Horton G, et al. Response rates in GP surveys: trialling two recruitment strategies. Aust Fam Physician 2011; 40: 427-430.
- 28. Solomon DH, Hashimoto H, Daltroy L, Liang MH. Techniques to improve physicians’ use of diagnostic tests: a new conceptual framework. JAMA 1998; 280: 2020-2027.
- 29. van Walraven C, Goel V, Chan B. Effect of population-based interventions on laboratory utilization: a time-series analysis. JAMA 1998; 280: 2028-2033.
- 30. Verstappen WHJM, van Merode F, Grimshaw J, et al. Comparing cost effects of two quality strategies to improve test ordering in primary care: a randomized trial. Int J Qual Health Care 2004; 16: 391-398.
- 31. van Bokhoven MA, Pleunis-van Empel MCH, Koch H, et al. Why do patients want to have their blood tested? A qualitative study of patient expectations in general practice. BMC Fam Pract 2006; 7: 75.
Abstract
Objective: To assess the number of pathology tests ordered by general practice registrars during their first 18–24 months of clinical general practice.
Design: Longitudinal analysis of ten rounds of data collection (2010–2014) for the Registrar Clinical Encounters in Training (ReCEnT) study, an ongoing, multicentre, cohort study of general practice registrars in Australia. The principal analysis employed negative binomial regression in a generalised estimating equations framework (to account for repeated measures on registrars).
Setting, participants: General practice registrars in training posts with five of 17 general practice regional training providers in five Australian states. The registrar participation rate was 96.4%.
Main outcome measure: Number of pathology tests requested per consultation. The time unit for analysis was the registrar training term (the 6-month full-time equivalent component of clinical training); registrars contributed data for up to four training terms.
Results: 876 registrars contributed data for 114 584 consultations. The number of pathology tests requested increased by 11% (95% CI, 8–15%; P < 0.001) per training term.
Conclusions: Contrary to expectations, pathology test ordering by general practice registrars increased significantly during their first 2 years of clinical practice. This causes concerns about overtesting. As established general practitioners order fewer tests than registrars, test ordering may peak during late vocational training and early career practice. Registrars need support during this difficult period in the development of their clinical practice patterns.