


Diabetes and its complications produce significant burdens for the health system in Australia. Between 2000–01 and 2008–09, total annual health expenditure for diabetes increased by 86% to $1507 million (2.3% of total health expenditure in 2008–09), an increase greater than that for all disease during the same period (60%).1
Indigenous Australians experience a disproportionally high burden of diabetes, which is responsible for 12% of the large gap in disability-adjusted life-years between Indigenous and non-Indigenous people.2 Indigenous Australians also have higher rates of hospitalisation for diabetes (3.4–5.0 times higher) and higher mortality rates from diabetes (7.0 times higher) than non-Indigenous Australians.3 They are also more likely to develop type 2 diabetes at an earlier age.4 Persistently high blood glucose levels cause organ damage, resulting in renal, circulatory and ophthalmic disorders. Indigenous Australians experience exceptionally high rates of these complications, including 11.2 times the rate of hospitalisation for renal failure4 and less effective care partnerships with their clinicians.5 It is therefore important to develop clinical programs that better manage diabetes and its complications in Indigenous people.
It was proposed that Indigenous health workers (IHWs) who are close to Indigenous communities linguistically and culturally could play an important role in improving the quality of primary health care for Indigenous Australians and contribute to better health outcomes. A trial of a recall system in remote Indigenous communities managed by local IHWs, supported by a diabetes outreach service, reported improved diabetes care and fewer hospitalisations.6,7 A 2006 study of the delivery of diabetes care in remote Indigenous communities found that employing more IHWs was associated with improved diabetes care, but not with better HbA1c control.8
The Getting Better at Chronic Care Project (GBACC) was a cluster randomised controlled trial (cluster RCT) designed to improve the care of people with poorly controlled diabetes living in 12 rural and remote Indigenous communities in north Queensland. Participants in the six intervention communities received, in addition to standard primary care, intensive chronic condition management for 18 months, delivered by IHWs who had a Certificate III or IV in Aboriginal and/or Torres Strait Islander Primary Health Care. The IHWs received additional training in diabetes management and intensive support from the clinical support team. The Indigenous health worker-supported (IHW-S) model was family-centred and based on community outreach. Control communities received usual care (UC) from a centre-based primary care team (nurses, general practitioners, IHWs etc), but with less intensive IHW support. Service configurations varied somewhat between communities.9
The primary clinical results have been published elsewhere.10 A process evaluation concluded that there was significant implementation failure during the 18-month intervention phase, and six key features were identified as either enabling or hindering implementation. Further, the restructuring of Queensland Health coincided with implementation of the project, generating a number of challenges to the project that had not been anticipated.11
This article reports the economic evaluation of the project. We completed a cost–consequence analysis, in which the costs of implementing the model were compared with differential changes in a range of health outcome measures in the intervention (IHW-S) and control (UC) groups.
Methods
Design
We conducted an economic analysis alongside a cluster RCT. The trial design, participants, sample size, outcomes and ethics approvals have been described elsewhere.9 Study participants were Indigenous people with poorly controlled type 2 diabetes mellitus (HbA1c levels ≥ 69 mmol/mol) and at least one other chronic condition. The primary clinical goal was a differential (IHW-S v UC) mean reduction in HbA1c levels of 12.6 mmol/mol during the trial. The intervention was implemented from 1 March 2012 to 5 September 2013.
Measurement of costs
We estimated the per person cost of the intervention on the basis of project costing records. We distinguished between costs for service delivery and support, and for management and evaluation activities related to running the trial. Costs were analysed separately for the central team and the IHWs (Box 1).
Measurement of outcomes
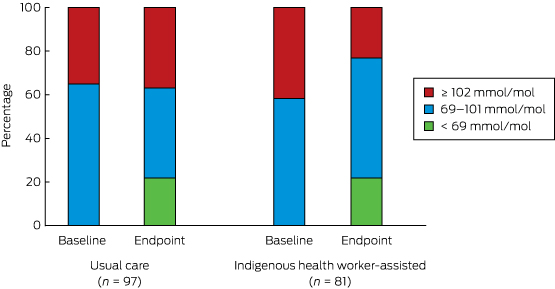
The primary outcome assessed in the clinical trial was the difference in change in HbA1c levels in the IHW-S and UC groups after 18 months. HbA1c measurements were extracted from participants’ clinical files. The baseline value was the HbA1c measurement closest to the participant’s recruitment date; the endpoint was the one closest to the trial endpoint. For the economic evaluation, we also explored the distribution of HbA1c data, given the limitations on using the mean to describe a distribution. We also estimated HbA1c outcomes in terms of shift in the numbers of people with moderate, poor and extremely poor diabetes control (as described below), given the relationship between diabetes control and health.
Secondary study outcomes included change in quality of life, disease progression, and rates of hospitalisation. Quality of life was measured with the Assessment of Quality of Life 4D (AQoL-4D) instrument. This has four dimensions (independent living, relationships, mental health, senses), each with three items and four levels. The AQoL-4D was developed in Australia, and the algorithm for estimating the utility score was derived from an Australian population.12 It has not been validated in an Australian Indigenous population.
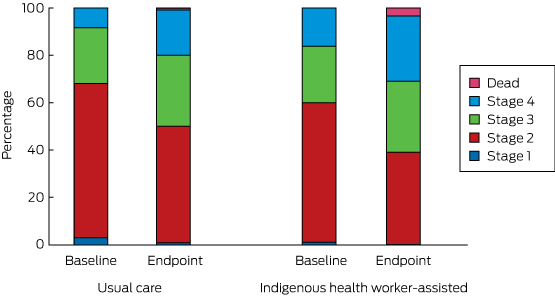
Disease progression was assessed by allocating a disease stage to each participant, based on clinical markers and hospitalisation data, and using the diabetes severity staging instrument developed by Gibson and colleagues (Box 2).13 Baseline disease stage was based on data for the period 1 July 2010 – 1 March 2012, endpoint disease stage on data for the period 1 March 2012 – 5 September 2013. Once allocated to a stage, there was no possibility of reverting to a less severe disease stage.
Hospitalisation data were derived from the Queensland Hospital Admitted Patients Data Collection, which covers all patient separations (discharges, deaths and transfers) from all public and licensed private hospitals in Queensland.14 Data were obtained for all inpatient episodes for participants discharged between 1 July 2010 and 5 September 2013. This included all inpatient discharges during a pre-intervention period of 20 months and for the 18 months of the intervention. Hospitalisations were categorised into four groups based on International Classification of Diseases, 10th revision (ICD-10) codes (Box 3). Length of stay-adjusted diagnosis-related group hospital costs were also extracted.17
Statistical analyses
The statistical analysis was conducted on an intention-to-treat basis and in accordance with current guidelines for clinical and economic analysis alongside a cluster RCT for assessing differential costs and consequences.18 We adopted methods that take into account within-community clustering and correlation of cost and outcome data. Of the available methods for the economic analysis of cluster RCTs,19 we applied linear multi-level models (MLMs). MLMs acknowledge clustering by including additional random terms that represent the differences between the cluster mean (costs and outcomes) from the overall means in each intervention group. MLMs are efficient and are applicable to RCTs with less than ten clusters in each trial arm.18 Analyses were undertaken with Stata 12.0 (StataCorp).
We used a Markov model to describe disease progression in the IHW-S and UC groups. The probability of staying in the current state or moving between baseline and endpoint to a more severe disease stage was estimated and presented in a transition matrix. This is a simple way of presenting the rate of disease progression and testing for an effect of the intervention.20
Results
One hundred participants were enrolled in the IHW-S group, and 113 in the UC group. Of these, 87 in the IHW-S and 106 in the UC group met the study inclusion criterion (HbA1c ≥ 69 mmol/mol). At baseline there were no statistically significant differences between the two groups in terms of age, body mass index, smoking or alcohol use (Box 4).
Costs of the intervention
Expenditure for the project is summarised in Box 5. The total cost was $1 991 904, of which $1 006 027 was attributed to intervention delivery. The remaining costs were allocated to research and other non-intervention activities. Total IHW salary cost (including on-costs) was $690 989. Three IHWs were employed full-time and three part-time. After adjusting for IHW involvement in other activities (6–56% of their time), the IHW salary cost attributed to the intervention was $522 421; the attributed cost of the trial manager and clinical support team was $483 606.
One hundred people received the intervention (of whom 87 met the study inclusion criteria), so that the average cost of delivering the intervention was $10 060 per person, or $6707 per person per year. This is the best estimate of the cost of rolling out a model incorporating the same elements as the GBACC.
Effectiveness of the intervention
Results of the incremental effectiveness analyses are reported in Box 6. The mean reduction in HbA1c levels in the IHW-S group was non-significantly greater than that for the UC group (–10.1 mmol/mol v –5.4 mmol/mol; P = 0.17). This slight difference from our earlier report10 is attributable to our excluding participants who failed to meet the study inclusion criteria from the current analysis. Both groups experienced a minor fall in quality of life (between-group difference, P = 0.62).
There was a statistically significant reduction in the proportion of participants with extremely poorly controlled HbA1c levels (≥ 102 mmol/mol) in the IHW-S group (from 34 to 19 people, or from 42% to 23%), but a slight increase in the UC group (34 to 36 people, or 35% to 37%; for between-group difference, P = 0.002) (Box 7). If the improvement in the IHW-S group had also been achieved by the UC group, 17 fewer people would have been expected to have had an HbA1c level ≥ 102 mmol/mol.
There were no significant changes in any of the hospitalisation categories. Rates of hospitalisations for all causes (excluding dialysis) and for type 2 diabetes-related diagnoses each increased in both groups; the small differences in favour of the IHW-S group were not statistically significant. Ambulatory care sensitive hospitalisations increased slightly in the UC group but not in the IHW-S group (P = 0.81). The only category in which the change approached statistical significance was for cases in which diabetes was the primary diagnosis: there was a differential net reduction in admission rate of 0.09 per person per year (P = 0.06) (Box 6). The effect size was small, amounting to an estimated eight fewer admissions per year among the 87 IHW participants. This suggests a possible small improvement in morbidity.
The transition between disease stages from baseline to endpoint is depicted in Box 8. The differences between the IHW-S and UC groups were not statistically significant (Markov transition matrix [Appendix], P = 0.73).
Cost-effectiveness of the intervention
Annual hospitalisation costs are reported in Box 6. There was a small reduction for most categories in the IHW-S group, but the difference only approached significance for type 2 diabetes as the primary diagnosis. Additional expenditure of just over $6700 per participant per year achieved no significant improvement in mean HbA1c levels, rate of disease progression, or quality of life, but realised a statistically sub-significant reduction in hospitalisations for those with type 2 diabetes as the primary diagnosis, yielding an estimated saving of $646 per person per year. The net intervention cost was thus just over $6000 per person per year, or $9000 for the 18-month trial. Taking into account the other significant finding, a reduction in the number of persons with very poorly controlled diabetes, this gives a cost of $42 880 for each person whose HbA1c level was reduced below the critically high level of ≥ 102 mmol/mol.
Discussion
The study examined the costs and outcomes of the GBACC model as implemented in this trial. It is one of few economic analyses of a new model of primary care for addressing poorly controlled diabetes in Indigenous people, building on a high quality cluster RCT design.
The average annual cost of just over $6700 per person for the intensive IHW-S intervention as an adjunct to regular primary care is high relative to the reported costs of primary care in Indigenous communities in Australia. One study estimated the mean annual primary care costs in 21 mainly remote Indigenous communities in north Queensland (including some of the communities involved in this trial) at $1825 per person in 2004–05, equivalent to about $2700 in 2012–13.21 This estimate included IHWs as well as medical, clinic health, nursing, managerial and clerical staff. The Australian Institute of Health and Welfare similarly reported that total primary care expenditure per Indigenous person was $2648 in 2012–13.22 Despite the higher expected primary care costs of a group with poorly controlled diabetes, $6700 per person per year is a considerable additional cost.
In terms of intervention effect, this economic study explored a range of outcomes, including mean HbA1c levels and their distribution, disease progression, quality of life, and hospitalisation. There was evidence of only a modest intervention effect, at best, in any of these measures. The only statistically significant improvement was the reduction in the proportion of patients with HbA1c levels of 102 mmol/mol or more. The difference in the reduction in number of hospitalisations for diabetes (as the primary diagnosis) was close to significant. The study was powered to detect a change in the primary outcome, a mean reduction in HbA1c levels of 12.6 mmol/mol over 18 months, not to detect changes in secondary outcomes such as hospitalisation or quality of life score.9 The effect of the intervention was assessed from the start of the trial, but there may have been a lag between its start and any impact on hospitalisation. A longer follow-up period than 18 months may have found a greater reduction in the hospitalisation rate.
Nonetheless, given the substantial additional resources that were invested, the outcomes were disappointing, with diabetes still poorly controlled in most patients, as indicated by the continued high levels of HbA1c, very high rates of disease progression, and increasing rates of hospitalisation.
There are a number of possible reasons for these outcomes. It is possible that intervening in a group of patients with less advanced disease would have been more successful. It was expected that the employed IHWs would devote 100% of their contracted work time to the trial, but other responsibilities within local health services reduced the capacity of some IHWs to support trial clients. While we adjusted for this in the costing of the trial, it will have diluted the intensity of service delivery. Combined with difficulties in recruiting and retaining staff, this meant that two communities received less than 65% of the intended level of intervention (Box 5). Any change in the IHW position will have disrupted the IHW relationship, a core element of the model. Nonetheless, good community commitment was achieved by ongoing community engagement, with the IHW model building on the Apunipima Cape York Health Council (ACYHC) family-centred approach. ACYHC was a partner in the trial, and author MW, who is a public health medical advisor with ACYHC, was a Chief Investigator in this trial.
Investment in the training and upgrading of qualifications of the IHW, as well as in providing clinical support for them is likely to generate value elsewhere in the health system and over the longer term, a likely benefit not captured by our analysis.
Data quality is a common issue in community trials. For example HbA1c data, which were extracted from participants’ clinical files, included some baseline data gathered well before the trial commenced.
It is also worth reflecting on whether the theory underpinning the trial was correct. In expanding the capacity of IHWs to provide direct and intensive support for Indigenous patients in the community, through both outreach and centre-based care, it was hoped to achieve more effective management of chronic disease because of greater cultural awareness and by improving patient engagement in self-care. While some health gains were identified, the major psychosocial and economic problems that are typical for very disadvantaged populations, and the strong relationship between these factors and chronic disease, mean that it may be necessary to address these factors more directly.23 Most of the IHW-S communities are in the bottom 2% of Queensland communities in terms of socio-economic disadvantage, indicating an extreme level of deprivation, often combined with a range of further serious adverse conditions.24 We did not have data on major life stressors (such as early death of family and friends, involvement with the criminal justice or child protection systems) that affect physical health and, probably, diabetes control; these factors may have affected the intervention and control communities differently.
A separate case study within the GBACC project found that health service providers need to review their systems of care to maximise the value of IHWs as specialist members of the multidisciplinary team.25 IHWs, who participated in regular clinical review sessions, were able to identify examples for improving self-management, which resulted in consistent positive change in HbA1c levels in patients with the poorest control. Further, IHWs could respond to the problem of patient disengagement.
Conclusions
Our results suggest that the costs of delivering the GBACC model were considerable in absolute terms but achieved only a modest effect. This suggests a need to consider how to improve the effectiveness of the program, reduce its costs, and to increase revenue (eg, through Medicare billings).
The training of IHWs and clinical support workers is generally viewed as positive, but translating it into measurable outcomes for people with poorly controlled type 2 diabetes in highly disadvantaged communities remains a challenge. A more holistic cross-agency approach may be required, one that seeks to directly address the psychosocial, pathophysiological and environmental problems that are common in highly disadvantaged populations. While the need to consider social and economic determinants is understood, there are still major gaps in service delivery. The challenge for the public health community is to devise and implement interventions based on broader understanding of the determinants of health and to test the effectiveness of such interventions.
Box 1 – Project cost calculations for the central team and the Indigenous health workers (IHWs)
The central team
Indigenous health workers
| |||||||||||||||
Box 2 – Diabetes vascular severity staging employed in this study, based on reference13
| |||||||||||||||
Box 3 – Categorisation of admissions to hospital in this study
| |||||||||||||||
Box 4 – Baseline characteristics of the study participants
Usual care |
Indigenous health worker-supported |
P |
|||||||||||||
Number of participants |
106 |
87 |
|||||||||||||
Mean HbA1c level (SD), mmol/mol |
95 (19) |
99 (17) |
0.12 |
||||||||||||
Mean age (SD), years |
47.6 (8.7) |
47.5 (10.6) |
0.958* |
||||||||||||
Sex (female) |
70 (66%) |
53 (61%) |
0.533† |
||||||||||||
Daily smoker |
38 (36%) |
34 (39%) |
0.654† |
||||||||||||
Current drinker |
39 (37%) |
36 (41%) |
0.511† |
||||||||||||
Mean body mass index (SD) |
32.6 (6.2)(n = 43) |
31.2 (6.3)(n = 44) |
0.522* |
||||||||||||
Obese‡ |
28 (65%) |
23 (52%) |
0.280† |
||||||||||||
SD = standard deviation. * Results of t test for equal means, adjusted for within-group clustering. † Results of χ2 test for equal proportions, adjusted for within-group clustering. ‡ Body mass index ≥ 30. | |||||||||||||||
Box 5 – Total cost estimates for the Getting Better at Chronic Care (GBACC) project
Total trial expenditure |
Time and cost allocated to GBACC intervention |
||||||||||||||
Time* |
Expenditure |
||||||||||||||
Central team |
|||||||||||||||
Clinical support team |
$626 091 |
57% |
$357 353 |
||||||||||||
Management |
$234 624 |
10% |
$23 462 |
||||||||||||
Operation |
$440 200 |
23% |
$102 791 |
||||||||||||
Sub-total |
$1 300 915 |
37% |
$483 606 |
||||||||||||
Indigenous health workers |
|||||||||||||||
Community A |
$151 551 |
78% |
$118 210 |
||||||||||||
Community B |
$151 551 |
64% |
$96 993 |
||||||||||||
Community C |
$75 775 |
44% |
$33 341 |
||||||||||||
Community D |
$78 028 |
89% |
$69 445 |
||||||||||||
Community E |
$156 056 |
84% |
$131 087 |
||||||||||||
Community F |
$78 028 |
94% |
$73 346 |
||||||||||||
Sub-total |
$690 989 |
76% |
$522 421 |
||||||||||||
Total expenditure |
$1 991 904 |
51% |
$1 006 027 |
||||||||||||
Source: Project financial reports. * The allocation of project team time to research and service delivery was determined by the program manager. Allocation of Indigenous health worker time to GBACC was based on time records. | |||||||||||||||
Box 6 – Summary of the incremental effectiveness analyses (change between baseline and trial end)
|
Usual care (n = 106) |
Indigenous health worker-supported (n = 87) |
Difference of differences† (95% CI) |
P |
||||||||||||
Baseline |
Endpoint |
Change* |
Baseline |
Endpoint |
Change* |
||||||||||
HbA1c level (SD), mmol/mol |
94.7 (19.0) |
89.3 (24.1) |
–5.4 (n = 97) |
99.0 (17.4) |
88.8 (25.7) |
–10.1 (n = 81) |
–4.7 (–11.6 to 2.1) |
0.174 |
|||||||
AQoL-4D, mean utility score (SD) |
0.80 (0.18) |
0.79 (0.21) |
–0.01 |
0.75 (0.18) |
0.72 (0.28) |
–0.03 |
–0.02 (–0.08 to 0.05) |
0.623 |
|||||||
Rate of hospitalisation (per person per year; total number of admissions in parentheses) | |||||||||||||||
All causes, excluding dialysis‡ |
1.02 (172) |
1.24 (176) |
0.22 |
0.98 (135) |
1.07 (124) |
0.09 |
–0.13 (–0.68 to 0.41) |
0.633 |
|||||||
Type 2 diabetes, any diagnosis§ |
0.53 (88) |
0.92 (128) |
0.39 |
0.47 (64) |
0.78 (88) |
0.31 |
–0.08 (–0.20 to 0.03) |
0.150 |
|||||||
Ambulatory care sensitive |
|||||||||||||||
All¶ |
0.33 (58) |
0.44 (60) |
0.11 |
0.31 (45) |
0.30 (36) |
–0.01 |
–0.11 (–1.04 to 0.81) |
0.811 |
|||||||
Type 2 diabetes as principal diagnosis** |
0.15 (26) |
0.18 (23) |
0.03 |
0.17 (23) |
0.11 (13) |
–0.06 |
–0.09 (–0.18 to 0.00) |
0.063 |
|||||||
Cardiovascular disease†† |
0.01 (1) |
0.08 (12) |
0.07 |
0.02 (3) |
0.04 (5) |
0.02 |
–0.05 (–0.13 to 0.02) |
0.149 |
|||||||
Infections‡‡ |
0.13 (21) |
0.14 (20) |
0.02 |
0.10 (14) |
0.09 (11) |
–0.01 |
–0.03 (–0.10 to 0.04) |
0.362 |
|||||||
Mean hospitalisation cost (per person per year) | |||||||||||||||
All causes |
$5438 |
$7421 |
$1982 |
$8010 |
$9866 |
$1856 |
–126 (–5024 to 4771) |
0.960 |
|||||||
Type 2 diabetes, any diagnosis§ |
$4248 |
$6582 |
$2335 |
$4921 |
$8595 |
$3674 |
1340 (–2724 to 5404) |
0.518 |
|||||||
Ambulatory care sensitive |
|||||||||||||||
All¶ |
$1665 |
$2132 |
$467 |
$2967 |
$2677 |
–$290 |
–757 (–2130 to 616) |
0.280 |
|||||||
Type 2 diabetes as principal diagnosis** |
$907 |
$1245 |
$338 |
$1553 |
$1245 |
–$308 |
–646 (–1348 to 56) |
0.071 |
|||||||
Cardiovascular disease†† |
$23 |
$163 |
$140 |
$239 |
$383 |
$144 |
4 (–749 to 757) |
0.992 |
|||||||
Infections‡‡ |
$623 |
$609 |
–$14 |
$1040 |
$451 |
–$589 |
–574 (–1490 to 342) |
0.219 |
|||||||
AQoL-4D = Assessment of Quality of Life 4D score. * Only participants for whom baseline HbA1c levels were measured after 1 January 2009 and endpoint levels after 1 March 2012 were included. † Estimates for incremental difference in outcomes between usual care and IHW groups using linear multi-level models adjusted for within-community clustering. ‡ Two people in the IHW group had dialysis after the intervention commenced (starting July 2012 and March 2013); their dialysis records were excluded. § International Classification of Diseases, revision 10 (ICD-10) code in principal or any other diagnoses starting with E11. ¶ All potentially preventable hospitalisations (ICD code in principal diagnosis: D501, D508, D509, E101–E108, E110–E118, E130–E138, E140–E148, E40–E43, E550, E643, E86, G40, G41, H66, H67, I10, I119, I110, I20, I240, I248, I249, I50, J02, J03, J06, J20, J312, J41–J44, J45, J46, J47, J81, K02–K06, K08, K098, K099, K12, K13, K250–K252, K254, K255, K256, K260–K262, K264–K266, K270–K272, K274–K276, K35–K37, K522, K528, K529, L03, L04, L08, L88, L980, L983, N10–N12, N136, N390, N70, N73, N74, O15, R02 or R56).16 ** ICD-10 code in principal diagnosis starts with E11. †† ICD-10 code in principal diagnosis: I10, I110, I119, I20, I240, I248, I249, J81 or I50. ‡‡ ICD-10 code in principal diagnosis: H66, H67, J02, J03, J06, J312, L03, L04, L08, L980, L88, L983, N10–N12, N136, N390, N70, N73, N74, or R02. | |||||||||||||||
Received 25 May 2015, accepted 25 November 2015
- Leonie Segal1
- Ha Nguyen2
- Barbara Schmidt2
- Mark Wenitong3,4
- Robyn A McDermott2
- 1 Health Economics and Social Policy Group, University of South Australia, Adelaide, SA
- 2 University of South Australia, Adelaide, SA
- 3 Apunipima Cape York Health Council, Cairns, QLD
- 4 National Aboriginal Community Controlled Health Organisation, Canberra, ACT
This economic evaluation was funded by a National Health and Medical Research Council (NHMRC) Program Grant (631947: Improving chronic disease outcomes for Indigenous Australians: causes, intervention, system change), and the trial was funded by an NHMRC Partnership Grant (570149). We acknowledge the considerable assistance provided by the project team, who have been extremely helpful in providing data. We also acknowledge the researchers and clinical support team who collected the baseline data, and the Indigenous health workers and clinical support team who delivered the program.
No relevant disclosures.
- 1. Australian Institute of Health and Welfare. Diabetes expenditure in Australia 2008–09 (AIHW Cat. No. CVD 62). Canberra: AIHW, 2013. http://www.aihw.gov.au/WorkArea/DownloadAsset.aspx?id=60129543916 (accessed June 2015).
- 2. Vos T, Barker B, Stanley L, Lopez A. The burden of disease and injury in Aboriginal and Torres Strait Islander peoples: Summary report. Brisbane: School of Population Health, the University of Queensland, 2007. https://www.lowitja.org.au/sites/default/files/docs/Indigenous-BoD-Summary-Report_0.pdf (accessed June 2015).
- 3. Australian Health Ministers’ Advisory Council. Aboriginal and Torres Strait Islander Health Performance Framework 2012 Report. Canberra: AHMAC, 2012. http://www.health.gov.au/internet/main/Publishing.nsf/Content/F766FC3D8A697685CA257BF0001C96E8/$File/hpf-2012.pdf (accessed June 2015).
- 4. MacRae A, Thomson N, Anomie, et al. Overview of Australian Indigenous health status 2012. Perth: Australian Indigenous HealthInfoNet, 2013. http://www.healthinfonet.ecu.edu.au/uploads/docs/overview_of_indigenous_health_2012.pdf (accessed June 2015).
- 5. Australian Bureau of Statistics. Australian Aboriginal and Torres Strait Islander Health Survey: biomedical results, 2012–13 (Cat. No. 4727.0.55.003). Canberra: ABS, 2014. http://www.ausstats.abs.gov.au/ausstats/subscriber.nsf/0/655722F5D777ACA4CA257D4E00170CEC/$File/4727.0.55.003%20publication.pdf (accessed June 2015).
- 6. McDermott R, Tulip F, Schmidt B, et al. Sustaining better diabetes care in remote indigenous Australian communities. BMJ 2003; 327: 428-430.
- 7. McDermott RA, Schmidt BA, Sinha A, Mills P. Improving diabetes care in the primary healthcare setting: a randomised cluster trial in remote Indigenous communities. Med J Aust 2001; 174: 497-502.
- 8. Si D, Bailie RS, Togni SJ, et al. Aboriginal health workers and diabetes care in remote community health centres: a mixed method analysis. Med J Aust 2006; 185: 40-45. <MJA full text>
- 9. Schmidt B, Wenitong M, Esterman A, et al. Getting better at chronic care in remote communities: study protocol for a pragmatic cluster randomised controlled [sic] of community based management. BMC Public Health 2012; 12: 1017.
- 10. McDermott RA, Schmidt B, Preece C, et al. Community health workers improve diabetes care in remote Australian Indigenous communities: results of a pragmatic cluster randomized controlled trial. BMC Health Serv Res 2015; 15: 68.
- 11. Schmidt B, Campbell S, McDermott R. Community health workers as chronic care coordinators: evaluation of an Australian Indigenous primary health care program. Aust N Z J Public Health 2015; doi: 10.1111/1753-6405.12480. [Epub ahead of print].
- 12. Centre for Health Economics, Monash University. AQoL-4D. Melbourne: Assessment of Quality of Life, 2014 [website]. http://www.aqol.com.au/choice-of-aqol-instrument/54.html (accessed Jan 2015).
- 13. Gibson OR, Segal L, McDermott RA. A simple diabetes vascular severity staging instrument and its application to a Torres Strait Islander and Aboriginal adult cohort of north Australia. BMC Health Serv Res 2012; 12: 185.
- 14. Health Statistics Centre, Queensland Health. Data quality statement — Queensland Hospital Admitted Patient Collection (QHAPDC). Brisbane: State of Queensland (Queensland Health), 2012. https://www.health.qld.gov.au/hsu/pdf/data-quality-statement/qhapdc.pdf (accessed June 2015).
- 15. Australian Institute of Health and Welfare. Aboriginal and Torres Strait Islander Health Performance Framework 2010 report: Queensland (AIHW Cat. No. IHW 66). Canberra: AIHW, 2011. http://www.aihw.gov.au/WorkArea/DownloadAsset.aspx?id=10737421355&libID=10737421355 (accessed June 2015).
- 16. Australian Institute of Health and Welfare. National report on health sector performance indicators 2003. Appendix 3 — Technical notes (AIHW Cat. No. HWI 78). Canberra: AIHW, 2004. http://www.aihw.gov.au/WorkArea/DownloadAsset.aspx?id=6442457957 (accessed June 2015).
- 17. Independent Hospital Pricing Authority. Appendix C. Cost weights (estimated ) for AR-DRG version 6.0x, round 16 (2011–12). In: National hospital cost data collection. Australian public hospitals cost report 2011–2012, round 16. Canberra, Department of Health, 2014: pp 122-154. http://www.health.gov.au/internet/ihpa/publishing.nsf/Content/CA25794400122452CA257CAC00117C4D/$File/round-16-cost-report.pdf (accessed June 2015).
- 18. Gomes M, Ng ES, Grieve R, et al. Developing appropriate methods for cost-effectiveness analysis of cluster randomized trials. Med Decis Making 2012; 32: 350-361.
- 19. Gomes M, Grieve R, Nixon R, et al. Statistical methods for cost-effectiveness analyses that use data from cluster randomized trials: a systematic review and checklist for critical appraisal. Med Decis Making 2012; 32: 209-220.
- 20. Gray A, Clarke P, Wolstenholme J, et al. Applied methods of cost-effectiveness analysis in healthcare. New York: Oxford University Press, 2011.
- 21. Gibson OR. The impact of primary health care resourcing on hospitalisation of Aboriginal and Torres Strait Islander adults with type 2 diabetes in far north Queensland, Australia [PhD thesis]. Adelaide: University of South Australia; 2013.
- 22. Australian Institute of Health and Welfare. Expenditure on health for Aboriginal and Torres Strait Islander people 2010–11. An analysis by remoteness and disease (AIHW Cat. No. HWE 58; Health and Welfare Expenditure Series No. 48). Canberra: AIHW, 2013. http://www.aihw.gov.au/WorkArea/DownloadAsset.aspx?id=60129544363 (accessed June 2015).
- 23. Leach MJ, Segal L. Patient attributes warranting consideration in clinical practice guidelines, health workforce planning and policy. BMC Health Serv Res 2011; 11: 221.
- 24. Australian Bureau of Statistics. 2033.0.55.001. Census of population and housing: Socio-Economic Indexes for Areas (SEIFA), Australia, 2011. Data cubes: State suburb Indexes, SEIFA 2011, Table 2: State suburb (SSC) Index of Relative Socio-economic Advantage and Disadvantage, 2011. Canberra: ABS; 2013. http://www.abs.gov.au/AUSSTATS/subscriber.nsf/log?openagent&2033.0.55.001%20ssc%20indexes.xls&2033.0.55.001&Data%20Cubes&F40D0630B245D5DCCA257B43000EA0F1&0&2011&05.04.2013&Latest (accessed June 2015).
- 25. Sands N, Bounghi A, Goodman S, et al. A case study: health workers linking the community to provide quality care [unpublished conference paper]. Connecting the care, across the lifespan (19th Annual Chronic Diseases Network Conference), Darwin, Australia, 24–25 September 2015.
Abstract
Objective: To conduct an economic evaluation of intensive management by Indigenous health workers (IHWs) of Indigenous adults with poorly controlled type 2 diabetes in rural and remote north Queensland.
Design: Cost–consequence analysis alongside a cluster randomised controlled trial of an intervention delivered between 1 March 2012 and 5 September 2013.
Setting: Twelve primary health care services in rural and remote north Queensland communities with predominantly Indigenous populations.
Participants: Indigenous adults with poorly controlled type 2 diabetes (HbA1c ≥ 69 mmol/mol) and at least one comorbidity (87 people in six IHW-supported communities (IHW-S); 106 in six usual care (UC) communities).
Main outcome measures: Per person cost of the intervention; differential changes in mean HbA1c levels, percentage with extremely poor HbA1c level control, quality of life, disease progression, and number of hospitalisations.
Results: The mean cost of the 18-month intervention trial was $10 060 per person ($6706 per year). The intervention was associated with a non-significantly greater reduction in mean HbA1c levels in the IHW-S group (–10.1 mmol/mol v –5.4 mmol/mol in the UC group; P = 0.17), a significant reduction in the proportion with extremely poor diabetes control (HbA1c ≥ 102 mmol/mol; P = 0.002), and a sub-significant differential reduction in hospitalisation rates for type 2 diabetes as primary diagnosis (–0.09 admissions/person/year; P = 0.06), with a net reduction in mean annual hospital costs of $646/person (P = 0.07). Quality of life utility scores declined in both groups (between-group difference, P = 0.62). Rates of disease progression were high in both groups (between-group difference, P = 0.73).
Conclusion: Relative to the high cost of the intervention, the IHW-S model as implemented is probably a poor investment. Incremental cost-effectiveness might be improved by a higher caseload per IHW, a longer evaluation time frame, and improved service integration. Further approaches to improving chronic disease outcomes in this very unwell population need to be explored, including holistic approaches that address the complex psychosocial, pathophysiological and environmental problems of highly disadvantaged populations.
Trial registration: ANZCTR12610000812099.