


The use of medicines for the treatment of disease is a common health-related action by Australians. Medicines are not only used to treat diagnosed medical conditions but, increasingly, to manage risk factors.1 Individuals’ patterns of medicines use are not well understood, including the combined use of prescription, over-the-counter (OTC) and complementary medicines. Smaller surveys of specific populations’ use of medicines have been conducted,2,3 but the most recent Australia-wide survey was the 1995 National Health Survey.4 A majority of published Australian research on the use of medicines is based on the analysis of dispensing data from the Australian Pharmaceutical Benefits Scheme and the Repatriation Pharmaceutical Benefits Scheme; however, these data sources do not include OTC, complementary and unsubsidised prescription medicines.5
Use of and access to medicines is changing. An ageing population is contributing to the national increase in medicine consumption and cost.6 The popularity of complementary medicines has led to increased access to these products through conventional sources of non-prescription medicines, such as pharmacies and supermarkets, as well as through complementary medicine practitioners.7,8 Our study, a national census of medicines use, aimed to address current knowledge gaps by exploring current use of prescription, OTC and complementary medicines, and the patterns and predictors of their use, by Australians aged 50 years and older.
Our descriptive study used a cross-sectional survey sent to a random sample of 4500 Australians aged 50 years and older. We sent out four mailings between June 2009 and February 2010 (to allow for potential seasonal variation). The survey was developed from pilot work conducted by the University of Melbourne, which compared a medicines diary with at-home pharmacist interviews and found that self-recording of medicines used was valid.9
A two-section questionnaire collected information on the use of all medicines. An inclusive definition of medicines was provided for participants (Box 1). The questionnaire was supplied only in English.
The study was approved by the University of Melbourne Human Research Ethics Committee.
Medicines were grouped by class, adapted from the classification system used by MIMS (Monthly index of medical specialties; http://www.mims. com.au). Up to three active ingredients were coded for each product. The components of multivitamin and multimineral complexes were not coded individually. The reasons for each medicine’s use were classified by the researchers to reflect participants’ descriptions. Data from the second section of the questionnaire were scanned into a database and merged with data from the first. Descriptive analysis was undertaken using SPSS, version 18.0 (SPSS Inc, Chicago, Ill, USA). Bivariate analyses were conducted using the χ2 test. Poststratification weights were applied using Australian population estimates for age and sex.10 Data that have not been weighted for age and sex are referred to as unweighted data.
A total of 1608 questionnaires were returned. Of the 4500 potential participants, 191 were ineligible; therefore the response rate was 37.3%.11 Data are reported only for the use of medicines in the previous 24 hours.
Study participants had similar sex and age distributions to those of the Australian population,11 with the exception of people aged 50–54 years, who were significantly underrepresented in unweighted data (Box 2).
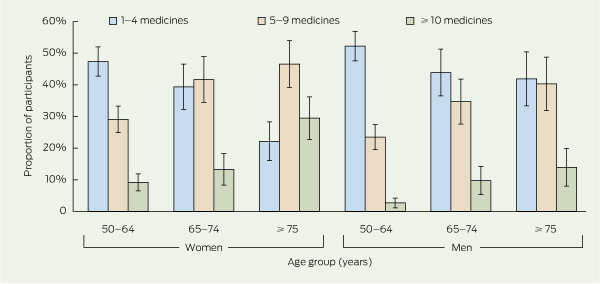
In total, 43.3% of participants reported use of five or more medicines of any type in the previous 24 hours, and 10.7% reported using 10 or more medicines. Almost a third (30.5%) used five or more conventional medicines, and 5.1% reported using five or more complementary medicines. (The number of medicines used, by age and sex, is shown in Box 3.) Polypharmacy was significantly associated with increasing age (32.2%, 49.4% and 66.0% for ages 50–64, 65–74 and ≥ 75 years, respectively; P < 0.001) and being female (50.2% v 35.3%; P < 0.001). Participants who self-reported “fair” or “poor” health status were significantly more likely to use more medicines than were those reporting “excellent” or “good” health (72.4% v 36.4%; P < 0.001).
A total of 1400 participants reported 7337 medicines used in the previous 24 hours, of which 89.2% were taken regularly and 10.8% were taken occasionally. Antihypertensive agents, natural marine and animal products and lipid-lowering agents were the most common classes of medicines used (Box 4).
The most commonly used active ingredients taken in either single- or multicomponent products were omega-3 marine triglycerides (such as fish oils), paracetamol, aspirin and glucosamine. Age differences existed for the use of several of these ingredients (Box 4).
More comprehensive tables of results for medicine components and medicine classes used are available at http://www.nps.org.au/research/medicinecensus/tables.
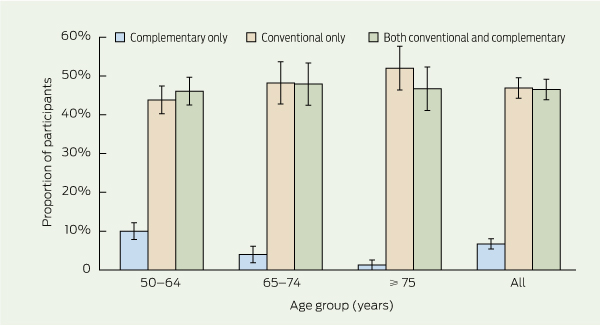
Complementary medicines were used by 46.3% of participants, representing just over half (53.2%) of all medicines users, 87.4% of whom used both conventional and complementary medicines. The mean number of complementary medicines used was 1.2 (range, 0–19). Women used more complementary medicines in the previous 24 hours than did men (1.5 v 0.8; P < 0.001). The use of only conventional medicines increased with age, while the use of only complementary medicines decreased (Box 5).
Although medicines can play a pivotal role in the quality of life of older people, polypharmacy can contribute to non-adherence and increase the risk of adverse drug reactions.12-14 Many consumers and health professionals may be unaware of the risk of potential interactions with complementary mediciness.7,15 Although the 1995 National Health Survey provided limited data on medicines use and involved a different recall period from our study (2 weeks compared with 24 hours), a simple comparison indicates that patterns of medicines use have changed over the past 15 years. In this period, the proportion of medicines users taking six or more conventional medicines increased by 13.9% to 39.8%, varying by age group and greatest among people aged ≥ 85 years (16.2% to 56.0%). There was also a substantial increase in the use of some medication classes. In 1995, 4.8% of participants (aged ≥ 45 years) used a lipid-lowering agent, compared with 30.4% in the present study, and the use of antidepressants increased from 3.7% to 9.4%.4
Our response rate may have introduced bias, as use of medicines may differ between responders and non-responders. The proportion of people taking medicines was similar to that found in recent United States studies.16,17 The response rate of 37% is reasonable compared with other postal surveys using Australian electoral enrollees.18 The sample had similar age and sex characteristics to the Australian population, although people aged 50–54 years were underrepresented. This may have been due to higher family or work commitments, or less interest due to lower medication use. To address differences, data were weighted to Australian Bureau of Statistics population estimates for age and sex. The use of a national random sample, a comprehensive and valid questionnaire to measure all medicines use, evidence-based best-practice methods for improving the response rate in postal surveys19 and the collection of medicines data in different seasons all strengthen the results of this study.
1 Definitions
Regular medicines: Taken daily or at regular intervals over time.
3 Number of medicines used in the previous 24 hours, by age group and sex — National Census of Medicines Use (June 2009 – February 2010)
Received 6 June 2011, accepted 29 August 2011
- Tessa K Morgan1
- Margaret Williamson1
- Marie Pirotta2
- Kay Stewart3
- Stephen P Myers4
- Joanne Barnes5
- 1 National Prescribing Service, Sydney, NSW.
- 2 Department of General Practice, University of Melbourne, Melbourne, VIC.
- 3 Centre for Medicine Use and Safety, Monash University, Melbourne, VIC.
- 4 School of Health and Human Sciences, Southern Cross University, Lismore, NSW.
- 5 School of Pharmacy, University of Auckland, Auckland, NZ.
This research was funded by the Australian Department of Health and Ageing through the National Prescribing Service and the University of Melbourne. Marie Pirotta is funded by a Primary Health Care Research Evaluation and Development fellowship. We also acknowledge the contribution of Rebecca Coleman and Liane Johnson for their advice during project development, Vinay Prasad for her support in distribution, and Jonathon Dartnell and Lynn Weekes for their thoughtful contribution to editing this article.
No relevant disclosures.
- 1. Australian Institute of Health and Welfare. Australia’s health 2010. Canberra: AIHW, 2010. (AIHW Cat. No. AUS 122; Australia’s Health Series No. 12.)
- 2. Byles JE, Heinze R, Nair BK, et al. Medication use among older Australian veterans and war widows. Int Med J 2003; 33: 388-392.
- 3. Hancock L, Walsh R, Henry DA, et al. Drug use in Australia: a community prevalence study. Med J Aust 1992; 156: 759-764.
- 4. Australian Bureau of Statistics. National Health Survey: use of medications, Australia, 1995. Canberra: ABS, 1999. (ABS Cat. No. 4377.0.) http://www.abs.gov.au/ausstats/abs@.nsf/productsby topic/BF60D2B59D518692CA2568 A9001393D1?OpenDocument (accessed Dec 2011).
- 5. Department of Health and Ageing. Australian statistics on medicines 2006. Canberra: Commonwealth of Australia, 2008.
- 6. Department of Health and Ageing. The impact of PBS reform. Report to Parliament on the National Health Amendment (Pharmaceutical Benefits Scheme) Act 2007. Canberra: Commonwealth of Australia, 2010.
- 7. Williamson M, Tudball J, Toms M, et al. Information use and needs of complementary medicines users. Sydney: National Prescribing Service, 2008. http://www.nps.org.au/research_and_evaluation/research/current_research/complementary_medicines/cms_users_research/complementary_medicines_consumer_research (accessed Mar 2011).
- 8. MacLennan AH, Myers SP, Taylor AW. The continuing use of complementary and alternative medicine in South Australia: costs and beliefs in 2004. Med J Aust 2006; 184: 27-31. <MJA full text>
- 9. Pirotta M, Lau P, Stewart K, et al. Australians’ use of medicines — comparison of data gathered by 7-day and 1-day diary and by pharmacist interview. Proceedings of the General Practice and Primary Health Care Research Conference; 2006 Jul 5-7; Perth, Australia. http://www.phcris.org.au/conference/browse.php?id=2343&spindex=3&catid=158&page=1&subcat=all&search=Pirotta (accessed Aug 2011).
- 10. Australian Bureau of Statistics. Australian demographic statistics, Jun 2009. Canberra: ABS, 2009. (ABS Cat. No. 3101.0.) http://www.abs. gov.au/AUSSTATS/abs@.nsf/0/EB76EA379A44 E842CA2576F0001C70C9?opendocument (accessed Dec 2011).
- 11. Data Analysis Australia. Response rates. http://www.daa.com.au/analytical-ideas/response-rates/ (accessed Feb 2011).
- 12. Easton K, Morgan T, Williamson M. Medication safety in the community: a review of the literature. Sydney: National Prescribing Service, 2009. http://www.nps.org.au/research_and_evaluation/current_research/medication_safety_community/complementary_medicines_report (accessed Mar 2011).
- 13. Cohen I, Rogers P, Burke V, et al. Predictors of medication use, compliance and symptoms of hypotension in a community-based sample of elderly men and women. J Clin Pharm Ther 1998; 23: 423-432.
- 14. Johnson M, Griffiths R, Piper M, et al. Risk factors for an untoward medication event among elders in community-based nursing caseloads in Australia. Public Health Nurs 2005; 22: 36-44.
- 15. Pirotta M, Kotsirilos V, Brown J, et al. Complementary medicine in general practice: a national survey of GP attitudes and knowledge. Aust Fam Physician 2010; 39: 946-950.
- 16. Slone Epidemiology Center. Patterns of medication use in the United States 2006: a report from the Slone Survey. Boston: Boston University, 2006.
- 17. National Center for Health Statistics. Health, United States, 2010: with special feature on death and dying. Hyattsville, Md: NCHS, 2011.
- 18. Breen CL, Shakeshaft AP, Doran CM, et al. Cost-effectiveness of follow-up contact for a postal survey: a randomised controlled trial. Aust N Z J Public Health 2010; 34: 508-512.
- 19. Edwards PJ, Roberts IG, Clarke MJ, et al. Methods to increase response rates to postal questionnaires. Cochrane Database Syst Rev 2007; (2): MR000008.
Abstract
Objective: To explore the current use of conventional and complementary medicines in Australians aged ≥ 50 years.
Design, setting and participants: Cross-sectional postal survey sent to a random sample of 4500 Australians aged ≥ 50 years between June 2009 and February 2010.
Main outcome measures: Prevalence of medicines use, reasons for medicines use and sources of medicines.
Results: Response rate was 37.3%. Medicines use was very common; 87.1% of participants took one or more medicines and 43.3% took five or more in the previous 24 hours. Complementary medicines were used by 46.3% of participants, 87.4% of whom used both conventional and complementary medicines. The most commonly used medicines were antihypertensive agents (43.2% of participants), natural marine and animal products including fish oil and glucosamine (32.4%) and lipid-lowering agents (30.4%). Doctors recommended 79.3% of all medicines and 93.0% of conventional medicines. Pharmacists commonly recommended occasional medicines (ie, as needed), while friends, family and media most often influenced use of complementary medicines.
Conclusions: The use of multiple medicines is common and higher than reported in the 1995 National Health Survey. Today, much medicines use is to prevent future disease by influencing risk factors. High levels of polypharmacy highlight the need to support the safe and effective use of medicines in the community. Although doctors recommend or prescribe most medicines, self-directed medication use is common. This highlights the need for consumer access to accurate information and strategies to improve health literacy about medicines.